2.1.2. Developments in 2014
Monetary Policy Developments
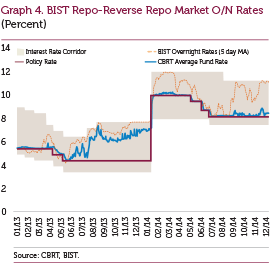
As a result of the uncertainty that has been heightening both locally and globally since late 2013, Turkey’s risk premium indicators deteriorated noticeably. In this period, exchange rate movements and rising volatility across financial markets had an adverse impact on the inflation outlook and macrofinancial stability. Therefore, by the strong and front-loaded monetary tightening implemented on 28 January 2014, the Committee aimed to control the deterioration in the inflation outlook and to support financial stability (Graph 4). With regard to simplifying the operational framework, the CBRT decided to provide liquidity primarily from the one- week repo rate instead of the marginal funding rate and raised the one-week repo rate from 4.5 percent to 10 percent. In this respect, additional monetary tightening (AMT) was terminated. The tight monetary policy stance and the recently alleviated uncertainty helped to contain the deterioration in medium-term inflation expectations; reduced the financial market volatility and slightly improved the risk premiums.
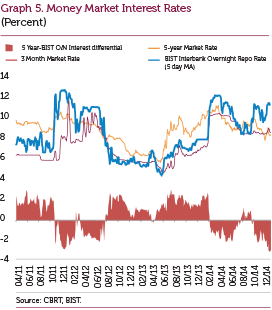
Owing to the decrease in risk premiums, the improving global liquidity conditions, the slowing trend of inflation and the waning cumulative effects of exchange rate depreciation on inflation during the second quarter of the year, the CBRT decided to deliver measured rate cuts. Firstly, in April, the late liquidity window lending rate was lowered from 15 to 13.5 percent. Then, the one-week repo rate was cut by 50, 75 and 50 basis points in May, June and July, respectively (Graph 4). In addition to the measured rate cuts, the Committee maintained a tight monetary policy stance by keeping the yield curve nearly flat. In this period, the spread between 5-year market rates and the BIST Interbank Overnight Repo rates was lower than the average over the past years (Graph 5).
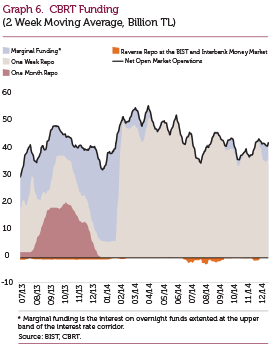
Furthermore, in order to ensure the symmetry of the interest rate corridor, the overnight lending rate was lowered from 12 to 11.25 percent, while the rate on borrowing facilities for primary dealers via repo transactions was cut from 11.5 to 10.75 percent in August. The CBRT continued to fund the market primarily via the one-week repo rate in the third quarter following the decision made at January’s interim MPC meeting that simplified the operational framework of monetary policy (Graph 6). The provision of liquidity primarily by one-week repo auctions enabled the CBRT average funding rate to near the weekly funding rate. Meanwhile, in view of the geopolitical tensions and the financial market volatility, the tight monetary policy stance has been invigorated by a tight liquidity policy since September. Thus, the BIST overnight repo rates that hovered around the one-week repo auction rate in July and August of 2014 settled close to the upper end of the interest rate corridor in this period (Graph 4).
In order to maintain balanced growth and capital inflows during the upcoming global monetary policy normalization, the CBRT has changed the foreign exchange deposit rates that apply to banks to borrow from the CBRT within their limits through the Foreign Exchange Deposit Market. As of 9 October 2014, the rates for one-week maturity borrowings from the CBRT as the last resort facility have been reduced from 10 percent to 7.5 percent for the USD and from 10 percent to 6.5 percent for the euro. Moreover, considering the increase in banks’ balance sheets and the CBRT’s international reserves, the CBRT increased the banks’ transaction limits at the Foreign Exchange and Banknotes Markets, which are currently 10.8 billion USD, to 21.62 billion USD as of 10 December 2014. Furthermore, the CBRT raised the limits of export rediscount loans and lowered loan costs on 20 October 2014 to support the balanced growth. These changes are expected to raise exporters’ borrowing from the CBRT, which will also lead to an increase in the CBRT’s FX reserves in 2015.
In addition, it was also stated that it is crucial to further strengthen the currently robust structure of the banking sector to enhance financial stability. Consequently, the CBRT announced on 21 October 2014 that it would provide additional support to core liabilities to stimulate balanced growth and domestic savings. To this end, the CBRT decided to remunerate the Turkish lira component of required reserves of financial institutions as an incentive, which will also reduce the sensitivity of the cost of Turkish lira required reserve holdings against the policy rate and thus strengthen the automatic stabilization feature of the ROM.
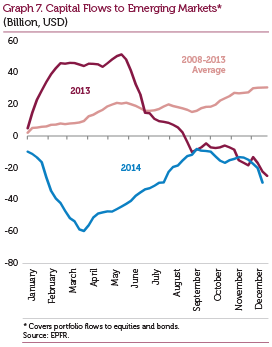
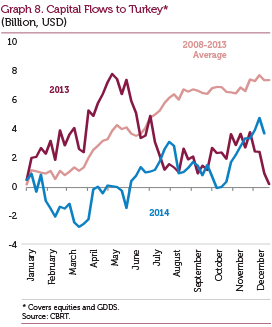
While the US Federal Reserve (Fed) ended its quantitative easing program in October, uncertainties regarding the timing and the magnitude of the policy rate hike have continued. Meanwhile, amid weak economic activity in the European Union (EU) and the growing risk of deflation, the European Central Bank (ECB) cut the policy rate in this period and announced a quantitative easing program that entailed the purchase of covered bonds and asset- backed securities. In the second and third quarters of 2014, indicators for global economic activity performed weaker than expected, causing growth forecasts for 2014 to be revised down. Financial market volatility and falling global growth rates led to some fluctuation in emerging market capital inflows during the entireyear (Graphs 7 and 8).
To eliminate the possible effects of the excessive volatility in the FX market on price stability and financial stability, the CBRT launched unsterilized FX sales auctions in the third quarter of 2013. These auctions were held throughout 2014 and total FX sales of USD 13.08 billion, USD 3.151 billion of which was made through direct intervention in January, reduced the CBRT reserves in this period. Reimbursement of rediscount credits of about USD 13 billion contributed to the CBRT reserves in the same period.
To support financial stability, the CBRT raised the reserve requirement ratios of FX-denominated non- core short-term liabilities of banks and financing companies in a way to prompt the extension of maturities in late 2014. The rise in FX reserve requirement ratios is expected to contribute to the CBRT’S FX reserves around USD 3.2 billion. The average FX reserve requirement ratio, which is currently 11.7 percent, will rise to 12.8 percent. Moreover, to strengthen the automatic stabilizing feature of the ROM, technical adjustments were made in reserve option tranches and coefficients to provide the FX liquidity due to the adaptations in reserve requirement ratios.
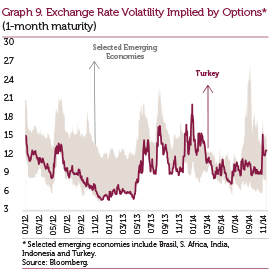
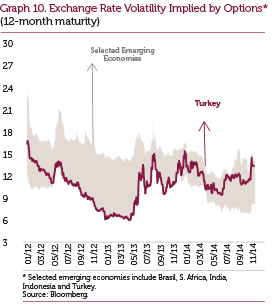
Due to the uncertainty stemming from the launch of the Fed’s exit from quantitative monetary easing in December 2013 coupled with Turkey-specific factors, the implied volatility of the Turkish lira displayed a higher increase than those in other emerging economies in early 2014 (Graph 9 and 10). The exchange rate volatility, which trended downwards in the second and third quarters of 2014, trended upwards again in December 2014.
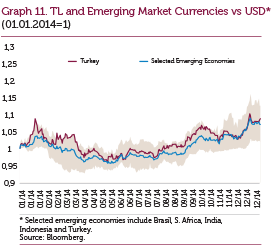
The Turkish lira and the currencies of other emerging economies with a high foreign financing requirement followed a parallel course in 2014 (Graph 11). The Turkish lira depreciated against the USD by around 9 percent in this period.
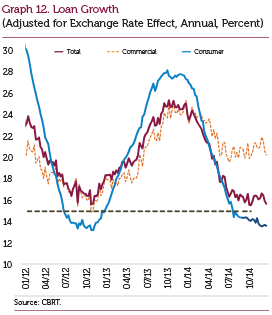
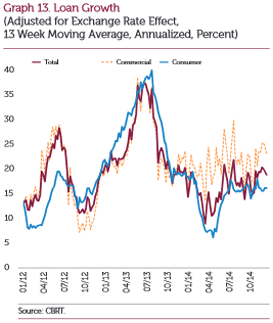
The annual growth rate of loans extended to the non-financial sector, which has been slowing due to the CBRT’s tight monetary policy and the Banking Regulation and Supervision Agency (BRSA)’s measures introduced in the start of the year, recorded a notable decline in 2014 (Graph 12). This fall was more evident in consumer loans due to the scope of the BRSA practices. From mid-2014, the annualized loan growth rate saw a partial increase on account of the improvement in consumer loans (Graph 13). Against these developments, the annual growth rate of total loans stood at 15.7 percent on 26 December 2014.
Inflation Developments
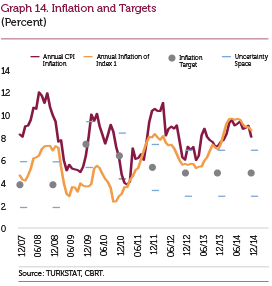
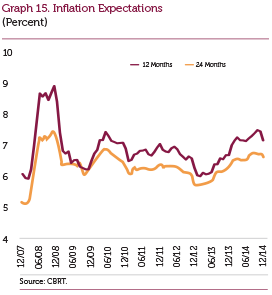
Inflation, which trended upwards in the first half of 2014 due to the effects of the depreciation in the Turkish lira since May 2013, assumed a downward course in the second half and stood at 8.17 percent at the year end. Inflation realizations remained above the uncertainty band owing to the exchange rate pass-through as well as the surge in food prices resulting from the negative supply shock amid drought and unfavorable weather conditions. On the other hand, the plunge in international oil prices in late 2014 had positive effects on energy prices, which accelerated the fall in inflation. Due particularly to the effects of the fall in fuel prices on certain services items, services inflation registered a decline in the last quarter of 2014. In addition, amid the alleviation of the exchange rate effects on the core goods inflation, core inflation indicators recorded an improvement (Graph 14). Inflation expectations, which trended upwards because ofcost shocks driven by the exchange rate effect and food prices across the year besides the deterioration in the pricing behavior in the first quarter, have recently witnessed a recovery amid the positive contribution of energy prices (Graph 15).
National Income Developments, Balancing Process and the Labor Market
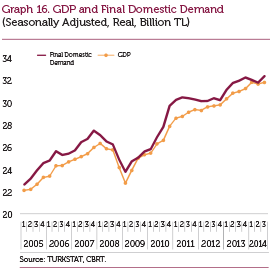
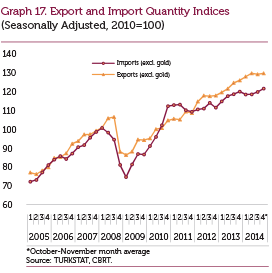
The new monetary policy that was adopted at end- 2010 accompanied by the macroprudential measures ensured a slowdown in domestic demand and imports, which led to the start of a balancing process between domestic and external demand. Thus, the contribution of net exports to growth increased considerably in 2012, whereas growth stood at 2.1 percent due to the slowdown in domestic demand. The current account deficit registered a sizeable decline in the same period. Meanwhile, economic growth re-accelerated in 2013 and reached 4 percent. According to the data released by TurkStat, the annual growth rate in the first quarter of 2014 was 2.8 percent and the mild growth trend was preserved. The weak course of the final domestic demand (FDD) and the stronger trend of increase in the exports excluding gold compared to imports excluding gold indicate that the balancing process continues (Graph 16 and 17). Thus, the trend of improvement in the current account deficit was sustained.
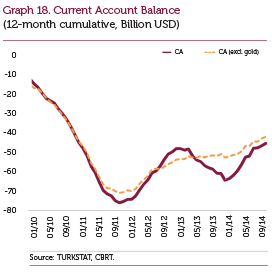
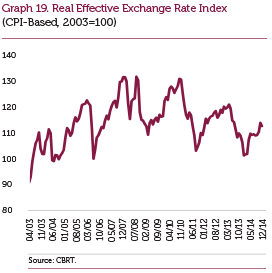
The balancing between domestic and external demand, which started in 2011, brought about an apparent improvement in the current account balance as well. Although the current account deficit saw a deterioration in 2013 due to the rise in net gold imports, the current account deficit excluding gold continued to improve gradually. In 2014, not only the convergence of net gold imports and past averages but also the deceleration in the rate of increase of the FDD led the improving trend in the current account deficit including and excluding gold to continue (Graph 18). Meanwhile, the new monetary policy adopted in late 2010 led the real exchange rate to register a decline that can be considered notable with respect to economic fundamentals (Graph 19). The real exchange rate, which depreciated sharply in the second half of 2013 owing to the uncertainties regarding the Fed’s monetary policies, assumed a trend of gradual appreciation as of early 2014. Despite this development, the average real exchange rate depreciated by 5.6 percent in 2014 compared to 2013.
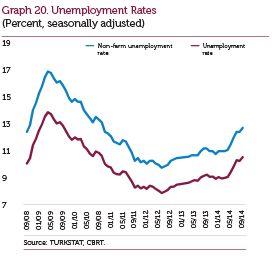
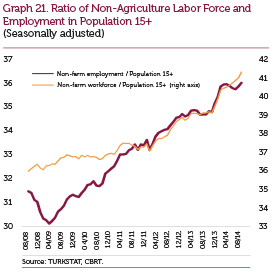
In 2014, total and non-farm unemployment rates displayed an increase (Graph 20). The upward trend in the labor power increased the non-farm unemployment rate throughout the year (Graph 21). Non-farm employment receded in the first half and added to the unemployment rate, but trended upwards in the second half. Across the sub-sectors of non-farm employment, following the plunge in the first half, construction employment partially improved in the second half of the year. The industrial sector did not spur an employment increase, while the services sector drove the rise in employment across the year.