MENU
MENU
MENU
MENU
Economic activity started to weaken as of mid-March due to the impact of the pandemic on foreign trade, tourism and domestic demand. The slowdown in the economy became more pronounced in April and spread across sectors. Following the sharp contraction in global economic activity, especially in our main trading partner Europe, export opportunities shrank significantly, and tourism activities came to a halt amid international travel restrictions. Mobility restrictions, such as economic shutdowns and curfews, which were strictly enforced until May, had a negative impact on economic activity and employment, especially in the hardest-hit services sector.
With the gradual easing of coronavirus restrictions since mid-May, accommodative policies have had a more marked effect on domestic demand and economic activity. Pent-up domestic demand recovered quickly amid the significant loosening in financial conditions and a strong credit impulse, and the economy recorded a strong bounce-back with the support of exports. Thus, after contracting by 11% in the second quarter of 2020, GDP grew by a robust 15.9% in the third quarter, exceeding its pre-pandemic level. In the last quarter, economic activity remained on an upward course, albeit with a slower pace. Against this background, growth in 2020 became 1.8%.
The rapid economic recovery driven by the strong credit impulse had visible repercussions on the external balance and the inflation outlook. The fast expansion in credits and monetary aggregates obtained within a short time supported the recovery in economic activity, but deteriorated the prospects for inflation and the current account balance. Despite the improvement in exports of goods, the current account deficit widened rapidly due to falling revenues from services, especially tourism, and buoyant imports. In this period, worsened inflation expectations as well as global uncertainties led to a strengthening trend in dollarization and affected the external balance adversely.
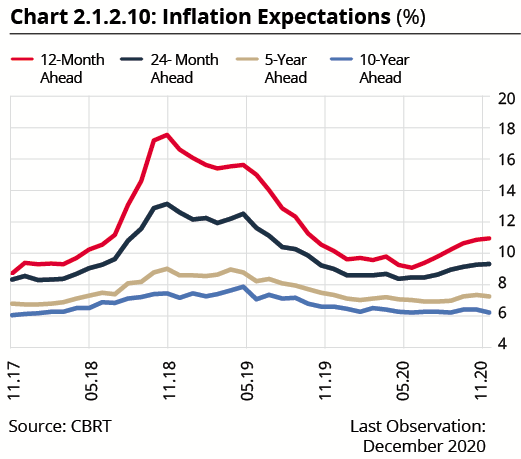
In 2020, the main driver of consumer inflation has been exchange rate developments. In the first ten months of the year, inflation remained almost flat at around 12%. While base effects mainly from energy and tobacco limited inflation, food and core goods inflation displayed an upward trend since July. Higher cost pressures arising mostly from exchange rates and demand-side factors triggered by the strong credit impulse had an adverse effect on inflation expectations and the inflation outlook, particularly in the second half of the year. Moreover, producer inflation soared in the second half of the year and cost pressures remained strong on consumer prices. Against this backdrop, annual consumer inflation climbed to 14.60% in December. In the second half of the year, core inflation indicators also followed a high course and price hikes spread across the whole.
As of November, the CBRT emphasized the importance of a decisive monetary policy stance focusing on price stability also taking macrofinancial risks into account. The CBRT took coordinated tightening steps in pandemic-related policies starting from early August, but lingering risks regarding macroeconomic stability necessitated a change in policies. Accordingly, the CBRT noted that a policy stance considering current risks and prioritizing the decline in inflation as of the first week of November. Consistent with this statement, to remove the risks to the inflation outlook, contain inflation expectations and restore the disinflation process as soon as possible, the CBRT delivered a clear and strong monetary tightening in November and December. Additionally, a simple monetary policy operational framework was adopted as of November. These monetary policy decisions were supported by a communication policy underlining that the CBRT will determine the policy stance preserving the priority of price stability.
Monetary Policy Developments
Assessing that the course of inflation was in line with the year-end projections, the CBRT continued policy-rate cuts which started in July 2019, and reductions in the policy rate totaled 125 basis points in January and February 2020. Macroeconomic indicators regarding the Turkish economy recorded a visible improvement in 2019. Inflation exhibited a sharp decline and the current account balance displayed a significant improvement. In the early phases of the pandemic, despite the depreciation in the Turkish lira, in line with global developments, plummeting international commodity prices, with oil and metal prices in the lead, affected the inflation outlook favorably. In this context, considering that downward risks to the year-end inflation projections has increased, the CBRT delivered a policy rate reduction of 200 basis points in March and April. In this period, to contain the adverse effects led by the pandemic on the Turkish economy, the CBRT announced comprehensive sets of measures aiming at maintaining the healthy functioning of financial markets, the credit channel and the cash flows to firms. Pandemic-specific supportive policy steps spilled over into the CBRT’s liquidity management strategy and low-cost funding was provided under three-month targeted liquidity facilities in this period.
Noting the rise in unit costs led by declining production and sales, the CBRT assessed that inflation might pick up slightly in the short term, while the disinflationary effects of aggregate demand conditions increased, and made a measured cut in the policy rate by 50 basis points in May. In June, the CBRT underlined that despite the limiting effects of aggregate demand conditions, the trend of core inflation indicators crept up due to the pandemic-driven rise in unit costs and kept the policy rate unchanged. Although maintaining the projection that demand-driven disinflationary effects would be more prevalent in the second half of the year, the CBRT kept the policy rate unchanged in July as the risks to year-end inflation projection were upside.
To keep inflation expectations under control and contain the risks to the inflation outlook, coordinated steps towards tightening in pandemic-specific policies were initiated as of early August and weekly repo auctions were suspended and the funding need was provided at overnight maturity. In September, the CBRT decided to increase policy rate by 200 basis points to restore the disinflation process and enhance price stability.
The CBRT kept the policy rate intact in October, yet decided to maintain the tight stance in monetary and liquidity policies until an evident improvement is seen in the inflation outlook. The monetary policy operational framework was changed and the margin between the CBRT Late Liquidity Window (LON) lending rate and overnight lending rate was set as 300 basis points.
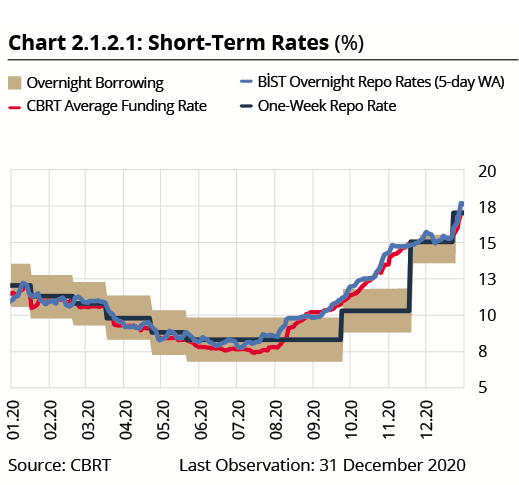
Amid the tightening efforts in the post-pandemic period, the weighted average funding cost increased by about 750 basis points to 14.87% from July to November. In November, to remove the risks to the inflation outlook, contain inflation expectations and restore the disinflation process within the shortest time possible, the policy rate was raised from 10.25% to 15%. In addition to the decision to raise the policy rate, the CBRT decided to make all the short-term funding through the one-week repo rate, which is the main policy tool, within a simple operational framework. In December, to restore the disinflation process as soon as possible, taking the end-2021 forecast target into account, the policy rate was raised from 15% to 17% (Chart 2.1.2.1).
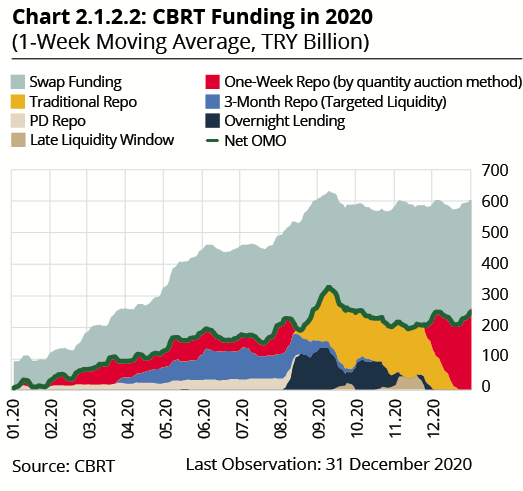
In 2020, the composition of the funding provided via OMO changed drastically due to new facilities that stepped in following the pandemic and financial market developments. In 2020, within the framework of OMO, the CBRT provided funding through one-week quantity repo auctions, PD liquidity facility, quantity repo auctions conducted within the framework of targeted additional liquidity facilities, one-month repo auctions held via the traditional method, overnight repo and deposit transactions and LON operations. Following the November MPC decision, a simple operational framework was adopted in OMO funding as all the short-term funding was provided at the one-week repo auction rate, which is the main policy rate (Chart 2.1.2.2).
The increase in the funding need of the system of approximately TRY 530 billion compared to end-2019 was mainly due to the rise in money in circulation, FX and gold transactions against TL and the amount of Treasury’s net borrowings. On the other hand, rediscount credits and the CBRT’s GDDS purchases were the factors to decrease the funding need of the system. The funding need of the system is met through net Open Market Operations (OMO) and swap transactions against FX and gold. Accordingly, swap transactions, which were TRY 74 billion at the end of 2019, increased by approximately TRY 264 billion to TRY 338 billion on 31 December 2020. Net OMOs, which were TRY 9.9 billion at the end of 2019, increased by approximately TRY 267 billion across the year and reached TRY 277 billion as of 31 December 2020 (Chart 2.1.2.2).
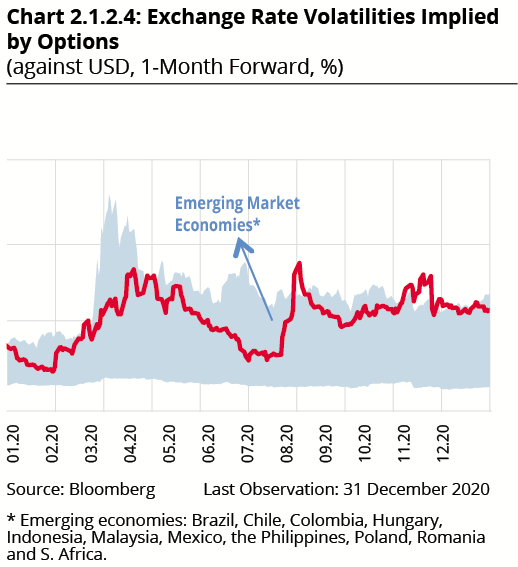
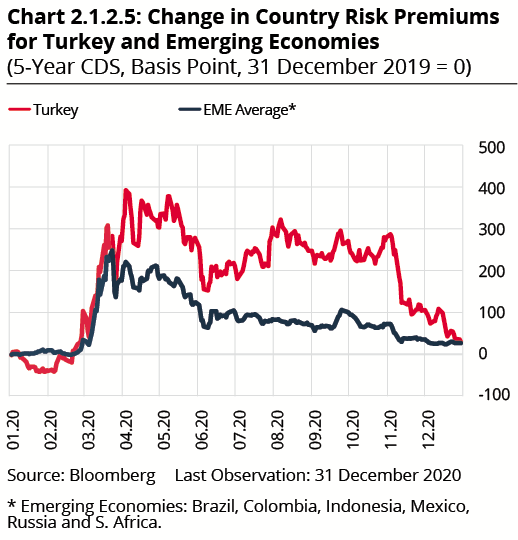
Marked by considerably volatile global risk appetite, the year 2020 saw increased portfolio outflows and exchange rate volatilities in emerging economies (Charts 2.1.2.3 and 2.1.2.4). In addition to the normalization steps taken by countries in the third quarter of the year, expectations that advanced and emerging economies would maintain their expansionary monetary and fiscal stances raised the global risk appetite. However, Turkey continued to post portfolio outflows due to country-specific factors in the third quarter, and hence diverged negatively from other emerging economies. After having increased significantly in early August, the volatility of the Turkish lira followed a fluctuating course and diverged negatively from other peer emerging market currencies.
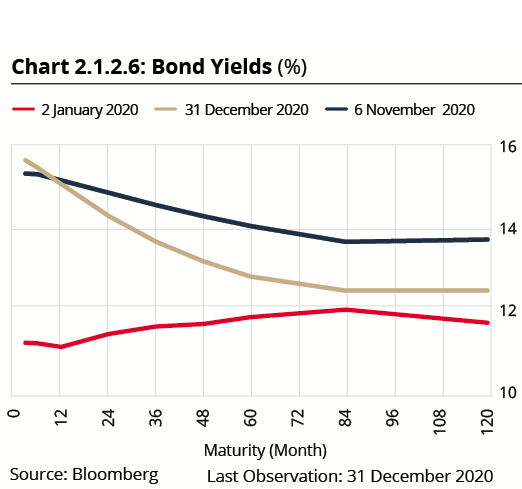
From November, the CBRT’s emphasis on price stability and clear communication prioritizing disinflation in the monetary policy decisions, as well as the strong monetary tightening delivered, led to a resumption in portfolio inflows and attenuated the volatility in the Turkish lira. Such a change in the monetary policy practices and communication reflected positively on the country risk premium, driving it downwards, particularly in the context of long-term bond yields (Chart 2.1.2.5 and Chart 2.1.2.6).
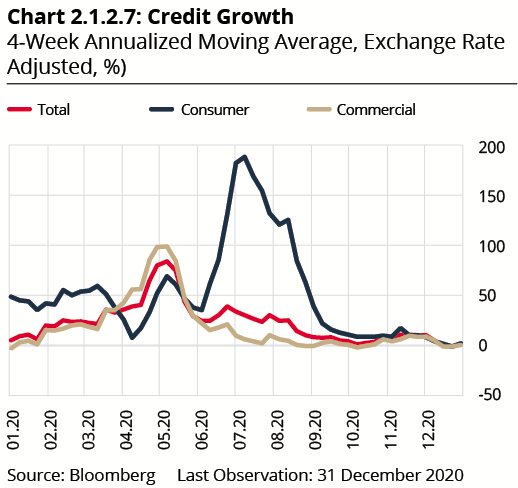
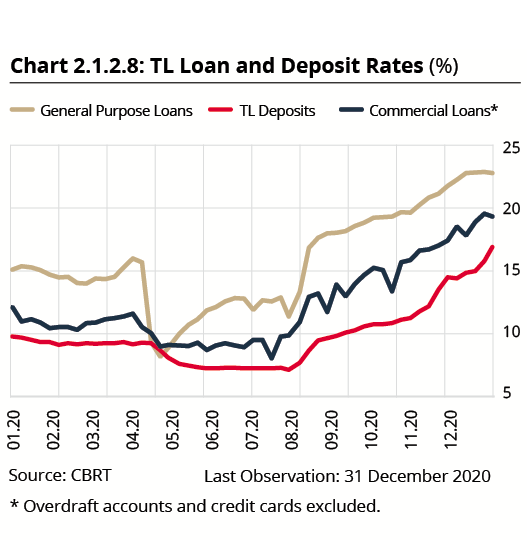
Credit growth-based RR regulations, stimulus packages offered in the second quarter of 2020 to alleviate the negative effects of the pandemic on households and firms, and the asset ratio rule enforced by the Banking Regulation and Supervision Agency (BRSA) resulted in a significant increase in loans in the second quarter of 2020 (Chart 2.1.2.7). On the back of the increase in loan rates in August, corporate loans and then personal loans assumed a normalization trend. The CBRT steps towards a strong monetary tightening since November affected loan and deposit rates significantly (Chart 2.1.2.8). As the monetary and liquidity policies impacted on loan and deposit rates, a significant tightening was achieved in financial conditions.

Inflation Developments
The stabilization of the Turkish lira on the back of the policies implemented, along with mild demand conditions and import prices, supported the fall of inflation in 2019. Although consumer inflation receded to a single-digit figure in September 2019, it rose in the last two months due to the base effect and closed the year at 11.84%. After having fluctuated around 12% through most of 2020, consumer inflation accelerated in the last quarter and stood at 14.60% at the end of the year (Chart 2.1.2.9). The main driver of the increase of inflation in 2020 was the depreciation of the Turkish lira. Unprocessed food prices and real unit labor costs also added to this increase. Meanwhile, demand conditions had a restraining effect on inflation in the first half of the year due to the pandemic, but this disinflationary effect remained limited in the second half in response to the normalization and the strong credit impulse. Against this background, sector-based divergences in demand were mirrored in inflation dynamics in 2020. In fact, inflationary pressures became evident in the durable goods group, where the strong credit impulse was having an effect, whereas the clothing and footwear group experienced the disinflationary effects of sectoral demand conditions that remained weak due to the outlook for tourism and unemployment. In 2020, US dollar-denominated import prices fluctuated but had an almost zero contribution to inflation. Inflation expectations rose in the second half of the year (Chart 2.1.2.10). As producer inflation soared in the second half and reached 25.15% by December, the cost-side pressures on consumer inflation also remained strong. Against this background, the trend of inflation rose in 2020, and the annual inflation of core indicators B and C increased to 14.52% and 14.31%, respectively.
After having fluctuated around 12% for most of the year, consumer inflation increased in the last two months of 2020 and overshot the October Inflation Report forecast. The main drivers of the increase in annual inflation were the core goods and food groups. Demand developments led by the strong credit impulse and exchange rates were the main determinants of the rise in core goods inflation. Amid strong demand conditions, higher costs weighed significantly on prices in durable goods - a key component of the core goods group- but annual inflation in the clothing group receded below its year-ago level thanks to the impact of the pandemic. The revision of SCT and tax base amounts applicable in new automobile purchases affected core goods inflation adversely. The pandemic-related supply and demand developments were instrumental in the increase of food inflation. Besides, exchange rate developments and the rise in international food prices were the other factors that had a negative impact on food inflation.
Annual services inflation fluctuated within a relatively flat narrow band in the first quarter of 2020 and started to show the restraining effects of the pandemic in March. Inflation in this group decelerated somewhat led by the items in which economic activity was interrupted in April and May due to the pandemic, but increased due to the items affected by the normalization process in June. Although inflationary pressures decreased slightly in the third quarter on the back of normalization steps, significant price hikes were seen in items sensitive to the exchange rate. The VAT cuts introduced in some of the services items affected the inflation in this group positively, albeit to a limited extent, whereas food prices and exchange rate developments became the prominent factors in the increase of annual services inflation in the last two months of the year. Annual energy inflation that increased in early 2020 due to the low base later assumed a downtrend following the sharp fall in international oil prices until May in response to the pandemic. In the succeeding period, annual energy inflation rose and remained high due to recovering international oil prices and exchange rate developments, but this rise was contained somewhat by high base effects arising from administered prices. The high base from the electricity price adjustment of the previous year curbed the hike made in electricity prices in October, and annual inflation registered a decline. Annual energy inflation increased slightly in the last two months of the year due also to international oil prices.

Supply - Demand Developments, External Balance and Labor Market
In the second half of 2019, economic activity gained strength on the back of the recovery in financial conditions and acceleration in credits and was mainly driven by domestic demand. Overall economic growth in 2019 was recorded as 0.9%.
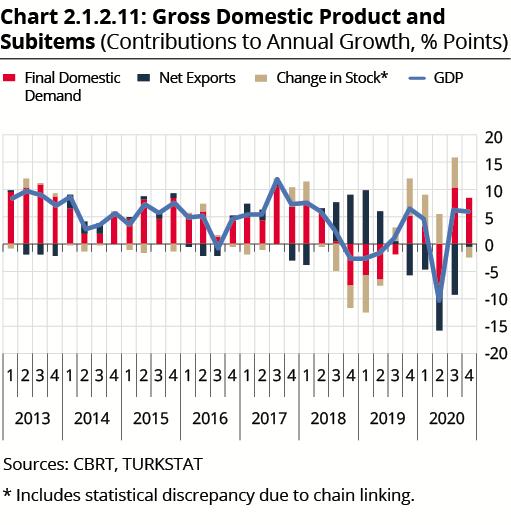
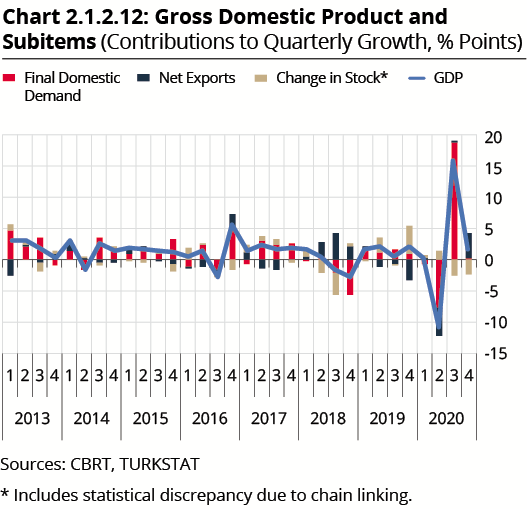
The strong course in economic activity continued into the January-February period of 2020. Since the second half of March, the coronavirus-related developments inhibited economic activity through the channels of foreign trade, tourism and domestic demand. The pandemic-driven economic slowdown seen since mid-March became more pronounced and spread across sectors in April due to increased measures. The economy started to recover in May following the gradual steps towards normalization. The monetary and fiscal measures implemented contributed to the economic recovery by supporting potential output. However, due to the weak course in April, gross domestic product (GDP) contracted by 11% quarter-on-quarter and by 10.3% year-on-year (Chart 2.1.2.11 and Chart 2.1.2.12). In the third quarter of 2020, on the back of the normalization process and the monetary expansion, coupled with the strong credit impulse, economic activity recorded a significant V-shaped recovery driven by domestic demand and exceeded its pre-pandemic level (Chart 2.1.2.12). In this period, the recovery spread widely across sectors, albeit with a more limited presence in the services sectors that were adversely affected by the pandemic. Data pertaining to the last quarter indicated that economic activity continued to grow at a slower pace in response to the cumulative effects of the strong credit impulse as well as the positive course in exports. In this period, GDP increased by 1.7% quarter-on-quarter and by 5.9% year-on-year. In the last quarter, while the quarterly growth was mainly driven by net exports, the contribution of final domestic demand remained limited at 0.3 points (Chart 2.1.2.12). Against this background, full-year 2020 growth was recorded as 1.8%.
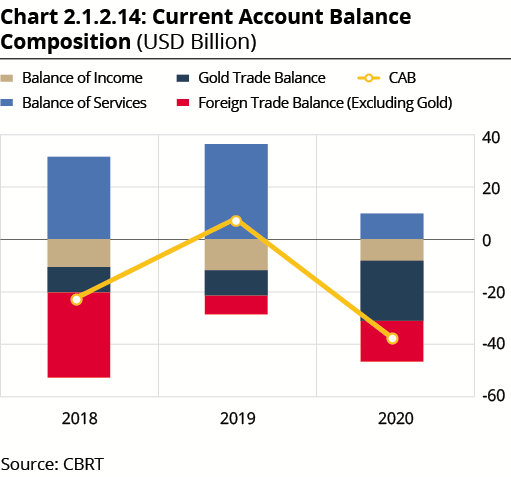
The current account balance posted a rapid recovery during the rebalancing process in 2019 and started to decline in the last quarter of that year on account of the strengthening activity (Chart 2.1.2.13). This downtrend gained pace in the second quarter in response to the adverse effects of the pandemic-related mobility restrictions on the foreign trade balance and tourism. Despite the rapid recovery in exports of goods in the succeeding period, the boosting effect of the strong credit growth on imports and the increased gold demand of residents played a role in the widening of the current account deficit. In the meantime, as the tourism and transport revenues were interrupted by the pandemic, the positive contribution of the balance of services to the current account balance remained limited (Chart 2.1.2.14). In this framework, the current account deficit rose to USD 36.7 billion in 2020. While this outlook increased the need for external financing, the current account deficit was largely financed by reserves due to weak capital flows. The corporate sector’s external debt reduction process continued in this period as well.
The decline in unemployment rates on the back of strengthening economic activity in the last quarter of 2019 continued in the first quarter of 2020 owing to the fall in the labor force participation rate. However, effects of the pandemic-driven business closures, capacity constraints and the slowing economic activity on the labor market became more pronounced in the second quarter. In this period, employment losses extended across all main sectors, most visibly in services, and reached approximately 2 million people. Nevertheless, as the persisting fall in the labor force participation rate became evident, the impact of employment losses on unemployment rates remained limited. In this period, subsidies provided through the unemployment insurance fund and current transfers, short-time work allowance in particular, played a critical role in limiting the income loss of households and maintaining employment. In the third quarter, the strong recovery in economic activity was reflected in the labor market, and unemployment rates receded on the back of the employment growth despite the recovery in participation rates. In the last quarter, the restraining effects of the deceleration in economic growth and the pandemic measures in the labor market started to be observed. While the labor force participation rate remained almost flat due to restrictions, the decline in unemployment rates slowed down in this period (Chart 2.1.2.15).