MENU
MENU
PART 2 ACTIVITIES AND MAJOR DEVELOPMENTS
2.1 Price Stability, Financial Stability and Monetary Policy
Following the slowdown in the second half of 2018, economic activity took a turn for a moderate recovery starting from the first quarter of 2019 on the back of policy actions and measures introduced, with a strengthening sectoral diffusion throughout the year. Domestic demand also registered a gradual recovery backed by the direct and indirect support of the public sector as well as by the improvement in financial conditions. However, investments remained weak due to the lagged effects of increased risk premium and tight financial conditions. Despite the deceleration in external demand, exports of goods and services remained strong due to competitiveness gains, and continued to bolster growth. On the other hand, the levels of domestic demand and real exchange rate curbed imports. Against this background, the current account balance significantly improved and registered a positive value for the first time since 2002. Accordingly, the external financing need decreased and the corporate sector continued to pay down debts rapidly.
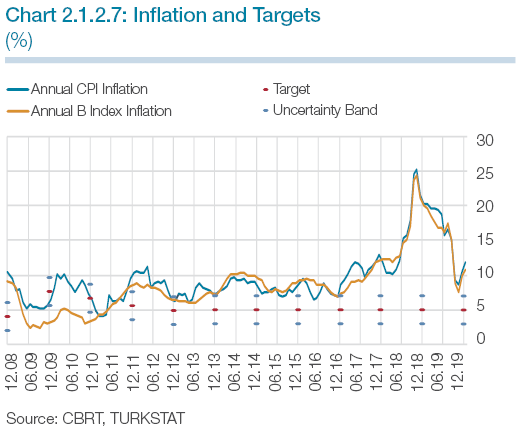
Consumer inflation significantly declined in 2019 and stood at 11.8% at the end of the year. The stable course of the Turkish lira driven by the tight monetary policy and coordinated policies, and the decrease in cumulative exchange rate effects constituted the main factors that underpinned the disinflation process. The domestic demand outlook, the weak course of import prices, and the downtrend in medium-term inflation expectations were the other major factors.
In 2019, the CBRT determined its monetary policy stance in a way to ensure the continuation of the disinflation process, and also effectively used macroprudential tools such as reserve requirements for financial stability purposes. The CBRT kept the policy rate unchanged in the first half of the year whereas it delivered a total of 12 points of rate cuts from July onwards taking into account the improvement in the inflation outlook.
Monetary Policy Developments
After the sharp depreciation of the Turkish lira in August 2018, the CBRT had delivered a strong monetary tightening in September to keep inflation and inflation expectations under control, and raised the policy rate to 24%. It had also emphasized that the tight monetary policy stance would be maintained until the inflation outlook displayed a significant improvement. As the exchange rate stabilized and inflation expectations started to decline by the last quarter of 2018 on the back of coordinated policies in effect, inflation dynamics recorded a visible improvement.
In 2019, the CBRT made its monetary policy decisions taking into account the indicators for the underlying trend of inflation, and determined the extent of monetary tightness in a way to ensure the continuation of the disinflation process and its consistency with the targeted path. The CBRT’s inflation forecasts and the underlying trends they imply had an important role in the decision-making process. In the first half of 2019, the CBRT kept the one-week repo auction rate constant at 24% and introduced a series of decisions regarding the liquidity management. The decline in the cumulative exchange rate effects due to the tight monetary policy stance and strong policy coordination, and the mild course of domestic demand led to a marked improvement in inflation dynamics. In the second half of the year, considering the improvement in the inflation outlook, the CBRT reduced the policy rate to 12% via rate cuts in July, September, October, and December (Chart 2.1.2.1).
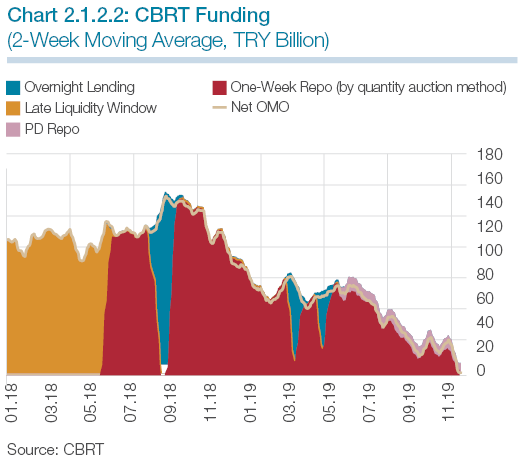
To ensure effective functioning of markets and transmission mechanism in the face of volatilities and unhealthy price formation in financial markets, the CBRT expanded its set of instruments in addition to the policy rate in 2019. Accordingly, to contain the adverse effects of the supply and demand imbalances that occurred in the offshore swap markets in the last week of March, the CBRT gradually raised the total limit of outstanding swap transactions at the Turkish Lira Currency Swap Market. It was noted that banks intensively used the CBRT’s swap facilities. In this regard, since the majority of the funding need of the system was met by the swap facilities of the CBRT, net funding via OMO gradually declined (Chart 2.1.2.2).
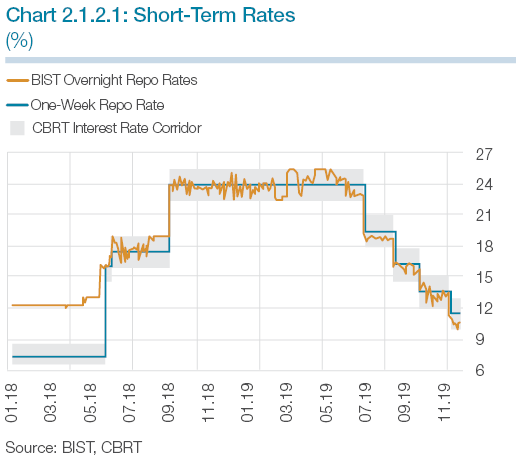
In 2019, funding via OMO was mostly done by one-week repo auctions but weekly repo auctions were suspended twice during the year due to the developments in financial markets. In these suspension periods, the entirety of CBRT funding was carried out over the CBRT overnight lending rate and overnight repo rates at the BIST converged to the upper bound of the CBRT’s interest rate corridor. As of 17 June 2019, primary dealers were provided with the facility to obtain liquidity within the framework of OMO at an interest rate set at 100 basis points below the CBRT’s policy rate. The share of liquidity offered under this facility remained limited within the funding need of the system.
The CBRT made some changes to reserve requirements to allow the use of this facility in a more flexible and effective way as a macroprudential tool to support financial stability. With an amendment to the CBRT Law No. 1211 in July 2019, it became possible that not only banks’ liabilities but also their on- and off-balance sheet items deemed appropriate could be subjected to reserve requirements. Accordingly, the reserve requirement ratios for Turkish lira liabilities and the remuneration rates for Turkish lira-denominated required reserves were linked to the annual growth rates of the total of banks’ Turkish lira-denominated standardized cash loans and cash loans under close monitoring, excluding foreign currency-indexed loans and loans extended to banks. In December, considering that it would be useful to have a reserve requirement practice that would support financial stability by encouraging channeling of loan supply towards production-oriented sectors rather than consumption-oriented ones, a revision was made in the reserve requirement regulation. Thus, it was intended to encourage long-term commercial loans that have a strong relation with production and investment, and long-term housing loans that have a weak relation with imports.
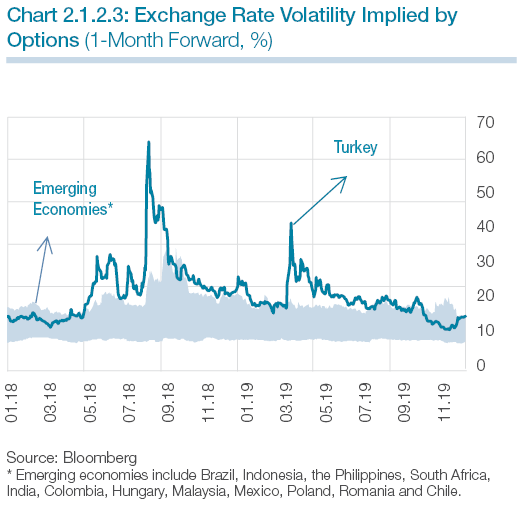
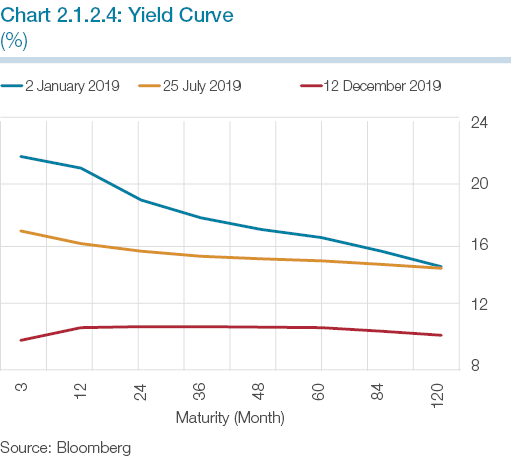
The implied volatility of the TL, which had reached high levels in August 2018, rapidly declined in the final quarter of the year on the back of coordinated policies. Although this volatility increased in some periods in 2019 due to geopolitical developments, the improving inflation outlook and the tight monetary policy stance kept it on a downtrend (Chart 2.1.2.3). The effective policy steps also had an impact on Turkish lira yields. Accordingly, in the first half of 2019 in which the CBRT emphasized that the tight monetary policy stance would be maintained until the inflation outlook displayed a significant improvement, yields – short-term ones in particular - decreased. Following the rate cuts that the CBRT delivered after July, the yield curve significantly declined across all maturities (Chart 2.1.2.4). In addition to these policy rate cuts, the improvement in inflation expectations and risk premium was also instrumental in the downward shift of the yield curve. The fall in long-term yields supports the view that the current monetary policy stance of the CBRT is consistent with the targeted disinflation path.
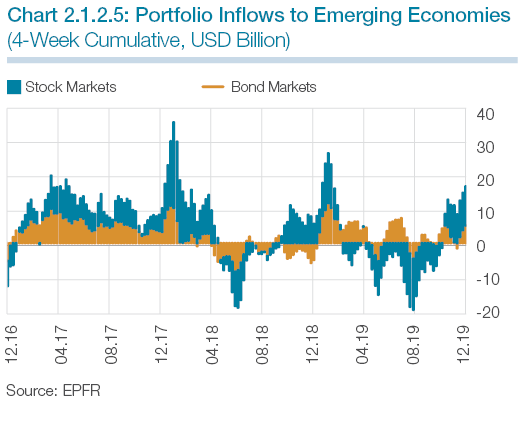
Starting from early 2019, stock markets of advanced economies were positively affected by the expectations that central banks of advanced economies, the Federal Reserve Board (Fed) in particular, would continue to ease their monetary policies in line with the developments regarding the global growth and inflation outlook. Despite the easing in monetary policies of advanced economies, portfolio flows to emerging market economies (EMEs) followed a fluctuating course throughout the year due to geopolitical developments and the trade tension between the US and China (Chart 2.1.2.5). In 2019, portfolio flows to Turkey registered a similar but weaker trend due to geopolitical uncertainties in particular.
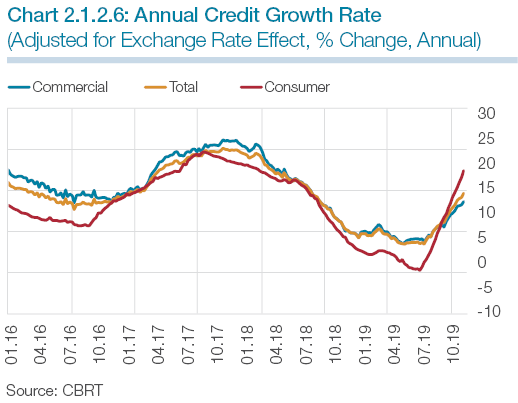
In the period after June 2019, credit demand revived due to the improvement in inflation expectations and financial conditions while the strong liquidity and capital structure of banks supported credit supply. From July onwards, credit utilization significantly accelerated as the policy rate cuts were reflected on credit interest rates. This acceleration started earlier and was stronger in consumer loans relative to commercial loans (Chart 2.1.2.6). The decline in domestic and external funding costs of banks and the recovery in economic activity accelerated as of the second half of the year, which constituted a significant determinant of the increase in loan growth in the final quarter.
Inflation Developments
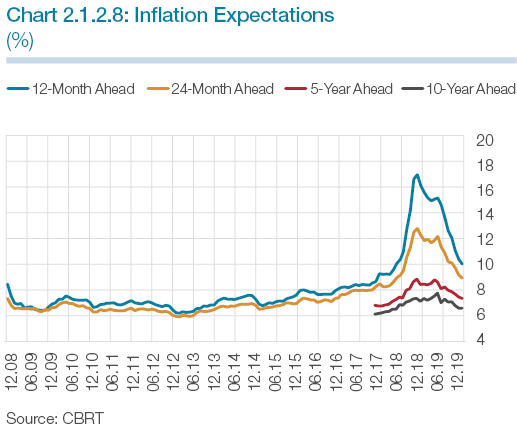
Consumer inflation, which materialized at 20.30% at end-2018 due to exchange rate developments and the deterioration in pricing behavior, declined significantly throughout 2019 and stood at 11.84% at the end of the year (Chart 2.1.2.7). Inflation expectations also declined substantially due to the fall in inflation and the monetary tightening (Chart 2.1.2.8). The cumulative effects of the depreciation of the Turkish lira waned and became the major driver of disinflation, while mild demand conditions and import prices also supported the fall in inflation. Meanwhile, real unit labor costs, together with tax and administered price adjustments pulled inflation up in 2019. Thanks to the year-long improvement in inflation expectations and pricing behavior, the trend of inflation also declined considerably and the annual inflation of core indicators B and C receded to 10.76% and 9.81%, respectively, at the end of the year.
Consumer inflation remained relatively flat in the first quarter of 2019, and the improvement in the inflation outlook that had started in the second quarter became evident in the third quarter, driving inflation to single digits in September. Despite a slight rise due to the base effect in the last two months of the year, inflation undershot the October Inflation Report forecast. The main drivers of the fall in annual inflation were the core goods and food groups. Core goods inflation declined due to waning cumulative effects of the exchange rate and the mild course of domestic demand, in addition to the base effect. The food inflation that had risen in response to adverse supply conditions in fresh fruits and vegetables in the first quarter trended down in the rest of the year. This is attributed, in addition to the base effect, to the increase in agricultural product supply, in fresh fruits and vegetables in particular, enabled by weather conditions turning favorable.
Although annual services inflation declined in the last quarter of 2019, it remained high throughout the year. Real unit labor costs, robust tourism demand, and backward indexation behavior were influential in the outlook for services prices. The outlook for energy prices was led by the developments in administered prices such as electricity, natural gas and municipal water prices in 2019, and the fall in energy inflation in the first half of the year was driven by these items. Although energy prices were up due to the adjustments in electricity and natural gas prices in the third quarter, annual energy inflation declined owing to the base effect. The sliding scale system in fuel products that was implemented from time to time contained price fluctuations throughout the year. In the meantime, price hikes in tobacco products led by ad valorem and specific Special Consumption Tax (SCT) regulations curbed disinflation.
Supply - Demand Developments, External Balance and Labor Market
In the second quarter of 2018, economic activity entered a rebalancing process in terms of speed and composition, followed by a contraction in the second half on the back of tightening financial conditions due to the rise in exchange rate volatility and risk premium. Thus, the growth, which was recorded as 2.8% in 2018, decelerated substantially compared to a year ago. While net exports became the main driver of growth, the decline in domestic demand put a cap on it.
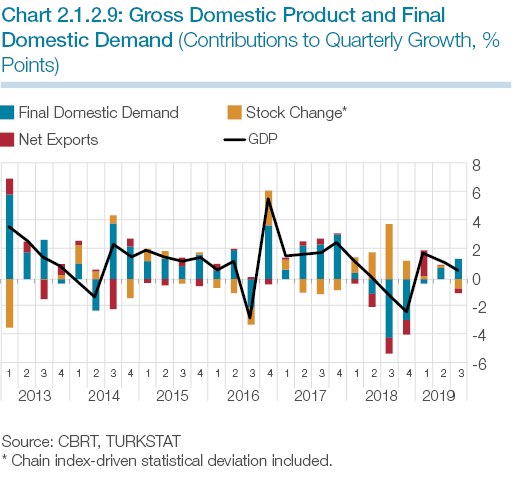
Economic activity has been on a recovery path since the first quarter of 2019 on the back of policy actions and measures taken. The recovery in the first half of the year was driven by both domestic demand and net exports. The main drivers of domestic demand were accommodative fiscal stance, tax incentives for durable consumer goods and consumer spending stimulated by the first quarter’s credit growth and wage increases. Investment spending, on the other hand, remained weak due to the high risk premium and tight financial conditions. In the third quarter, economic recovery continued and the annual growth returned to positive territory. The improvement in the sectoral diffusion of the recovery grew strong in this period. Reduced financial volatility and uncertainty as well as rising credit use fueled domestic demand. Although Turkey’s competitive advantage remained supportive of exports of goods and services, net exports, along with increased import demand triggered by the recovering domestic demand, contributed negatively to annual and quarterly growth (Chart 2.1.2.9).
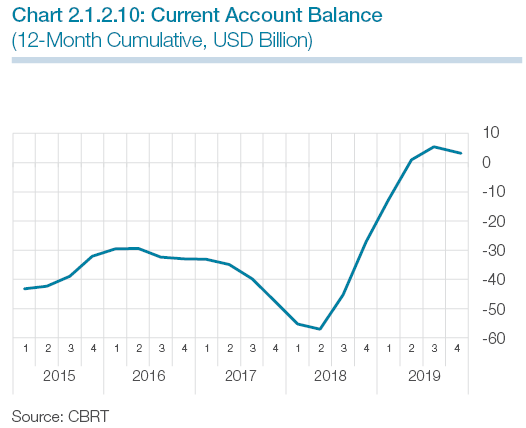
The current account balance continued to improve in 2019 (Chart 2.1.2.10). This trend of the current account balance, which declined rapidly on account of the rebalancing process that had started in the second half of 2018, continued throughout the year. The annualized current account balance posted a surplus in June for the first time since 2002, and remained in positive territory as of October. While this outlook diminished the need for external financing, it also speeded up the corporate sector’s external debt reduction process. On the foreign trade front, the growth rate of exports declined due to the weakening economic activity and various quota practices in the EU, our largest export market. However, competitiveness gains and firms’ orientation to exports as well as their flexibility in product and market diversification enabled compensation of export losses significantly and curbed this deceleration.
The ongoing contraction in imports ended in the first half of the year thanks to the removal of the low base effect in 2018, and imports started to increase on the back of the economic recovery in the second half. Meanwhile, energy imports fell in line with the decline in oil prices and their negative impact on the current account balance subsided. Tourism revenues continued to increase at a stronger pace in 2019, thereby providing higher positive contribution to the current account balance.
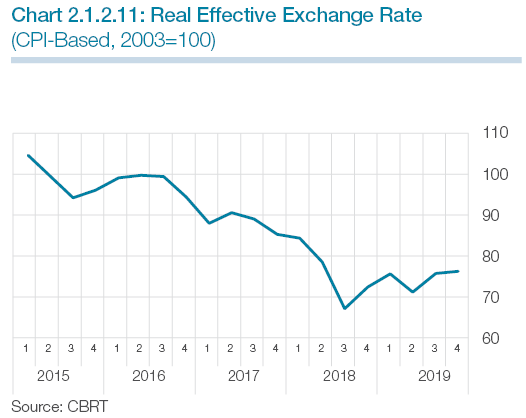
Throughout 2019, the real exchange rate posted a limited decline compared to the preceding year (Chart 2.1.2.11). Following the dramatic depreciation of the Turkish lira in 2018, the level of the real exchange rate in 2019 continued to put pressure on import demand. Against this background, the foreign trade balance hovered below its historical average and contributed significantly to the noticeable improvement in the current account balance.
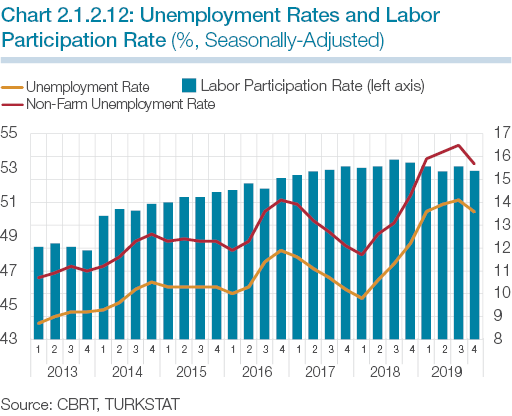
Unemployment rates had trended upwards since the second quarter of 2018 due to the slowing economic activity and remained on the rise in the first three quarters of 2019 on account of the weak non-farm, particularly the construction sector, employment. However, with economic recovery growing strong, the labor market started to improve in the last quarter and unemployment rates declined on the back of the increase in non-farm employment (Chart 2.1.2.12)