2.1.3. Implementation and Outcomes of the New Policy Mix
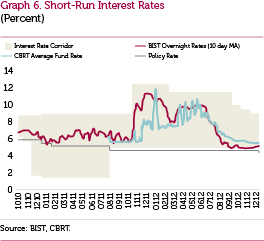
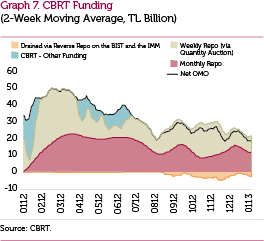
Notwithstanding the favorable course of global risk perceptions in the first quarter of 2012, the CBRT has pursued a cautious monetary policy in view of the still-brisk upward risks on cost factors. Considering the accommodative policies on a global scale, the upper limit of the interest rate corridor was reduced by 100 basis points in February (Graph 6). On the other hand, an additional monetary tightening was implemented between 23 and 29 March 2012 to prevent the hikes in oil prices and other cost factors from distorting inflation expectations. In this period, the weighted average rate of the liquidity offered to the market was raised by reducing the one-week repo funding amount quoted at the policy rate (Graph 7). At the MPC Meeting of March 2012, the ratio of TL required reserves that can be held in gold was raised from 10 percent to 20 percent.
The CBRT pointed out that additional monetary tightening might be implemented more often so as to prevent the temporary rises in inflation in the second quarter from distorting the inflation outlook. Accordingly, additional monetary tightening was conducted between 11 and 17 April, 4 and 11 May and 21 and 25 May 2012. In spite of an expected fall in inflation, inflation will overshoot the target remarkably until the last quarter of the year, which may pose risks to the pricing behaviors. With a view to containing these risks, the existing tight stance was preserved in the May MPC Meeting, and an additional monetary tightening was implemented between 31 May and 4 June. In fact, in the second quarter, alternative funding instruments excluding one-week quantity repo funding were used more frequently compared to the first quarter (Graph 6).
In the succeeding period, a cautious monetary policy stance was maintained. However, parallel to the rise in the risk appetite, it was made sure that both the average funding rate and the overnight rate in the market remained low in July. At the May MPC meeting, foreign exchange reserve option facility was increased from 40 percent to 45 percent to bolster financial stability. Meanwhile, to reduce the cost differential between holding the required reserves in TL or foreign exchange, the ROC was put into practice for additional facilities. This allowed holding of TL required reserves in USD and/or euro with a multiplier of 1 for the first tranche of 40 percent (as in the past) and 1.4 for the second tranche of 5 percent. The facility was increased to 55 percent with increments of 5 percentage points in June and July, and coefficients for the sum corresponding to the second and third tranches of 5 percent were set as "1.7" and "1.9". In addition, the upper limit for TL required reserves that can be held in gold was raised to 25 percent in June, while it was decided that the amount corresponding to the first tranche of 20 percent of the facility would be multiplied by 1 (as in the past), and 1.5 for the second tranche of 5 percent.
Considering that the central banks of advanced economies opted for an additional monetary tightening in the third quarter of the year, which bears the potential to accelerate capital flows, the CBRT narrowed the interest rate corridor by lowering the overnight lending rate by 150 and 50 basis points in September and October, respectively. However, due to the persisting uncertainties regarding the global economy, monetary policy remained flexible (Graph 6). In this period, the mild recovery in the final domestic demand and favorable data regarding other macroeconomic variables paved the way for the formation of an average interest rate at low levels. Accordingly, the CBRT funded the market mostly through one-week quantity repo auctions and traditional monthly repo auctions. On the other hand, at the August MPC meeting, the foreign exchange reserve option was raised from 55 percent to 60 percent, and the ROC for this tranche was set as "2". Additionally, to bolster financial stability, the ROC corresponding to the first 40 percent tranche of the TL required reserves was raised to "1.1". Moreover, to the same end, the upper limit to establish TL required reserves in gold, which was 25 percent, was increased to 30 percent, and the ROC corresponding to the additional tranche of 5 percent was set as "2". In order to bolster financial stability, reserve option coefficients for all tranches were raised by "0.2" and "0.1" percentage points in the September and October MPC meetings, respectively.
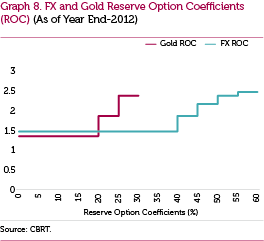
In spite of the rise in the global risk appetite in the last quarter, the recovery in the inflation outlook and the more pronounced stabilization process in the economy, uncertainties regarding the global economy have persisted. Thus, the CBRT continued with flexible monetary policy practices taking macro financial risks into account. Improvement in risk perceptions regarding Turkey, the active use of the ROM and the mild course of commercial loans facilitated a moderate reduction in the upper limit of the interest rate corridor; and the overnight lending rate and the policy rate were reduced by 50 and 25 basis points, respectively (Graph 6). Moreover, in order to enhance financial stability, FX reserve option coefficients were raised by "0.1" percentage points for the tranches succeeding the first tranche of 40 percent, and gold reserve option coefficients were raised by "0.2" percentage points for all tranches in November. Graph 8 exhibits the reserve option coefficients for the FX and gold for end-2012. Furthermore, FX required reserve ratios were increased by 0.5 percentage points for deposits with 1-year and longer maturities in addition to those maturities excluding other liabilities with longer than 3 year-maturities in December. On the other hand, in this period, the CBRT continued to fund the market mostly through one-week quantity repo auctions, and one-month traditional repo auctions, thereby ensuring the weighted average cost of the CBRT funding rate to hover around the policy rate.
Credits
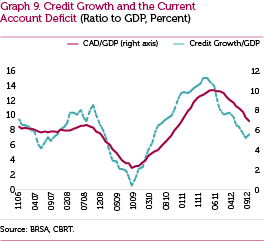
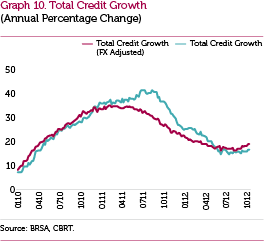
The CBRT closely monitored the developments in credits and the exchange rates with a view to averting the risks stemming from increased capital inflows in the macroeconomic and financial system in 2012 Containing the excessive growth of credits, which is closely related to the current account deficit, is of great importance with regard to containing the negative effects of the volatility in capital flows. The net credit utilization ratio (i.e., the change in the credit stock/GDP), which is an indicator that summarizes economic effects of credit growth most accurately, went down to plausible levels in terms of financial stability as of mid 2011. In parallel, Graph 9 shows that the current account balance displayed a gradual recovery. In order to prevent the surge in credits, policy instruments such as required reserve ratios, liquidity policy, capital adequacy risk weights, general provisions and loan to value ratio were actively used in 2012 through the coordinated functioning of the CBRT and relevant authorities. As a result of these measures, the credit growth rate, adjusted for the FX rate effect, which hovered at highly risky levels above 30 percent in 2010, fell to 25 percent in 2011, and 15 percent in October 2012. In the last quarter of 2012, the credit growth rate, which increased because of the rebound in economic activity and accommodative liquidity conditions, realized 18.4 percent at the year-end (Graph 10).
Credit growth hovers around reasonable levels with regard to financial stability thanks to the flexible monetary policy that also considers macro-financial risks and the measures taken by the authorities to elevate credit costs. Preventing the sector's annual credit growth rate from climbing to high levels in the forthcoming period will bolster price stability and financial stability. Under a baseline scenario that entails plausible levels of credit growth rate, the current account balance is also expected to follow a sustainable course.
Foreign Exchange Rates
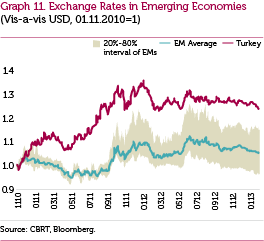
Another channel considered significant and closely monitored by the CBRT to alleviate the adverse effects of capital flows is the exchange rates. Through the policies that have been conducted since 2010, the CBRT aimed at containing the resulting higher volatility from increased capital flows. In this context, with the goal of eliminating the excessive appreciation in the TL, policy rates were reduced and the interest rate corridor was widened downwards; thus, short term market rates were allowed to follow a volatile course (Graph 6). Accordingly, the TL, which followed a course parallel to the currencies of similar markets until end-2010, exhibited an evident divergence from that time onwards (Graph 11).
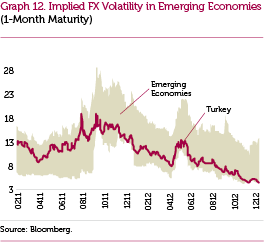
The interest rate corridor system and the ROM practiced by the CBRT enabled the exchange rates to display lower volatility than other emerging markets. In this context, even though the TL notably depreciated both in 2011 and in 2012 compared to other emerging markets, the exchange rates proved less volatile than that in countries of the same group (Graph 12).
Stabilization
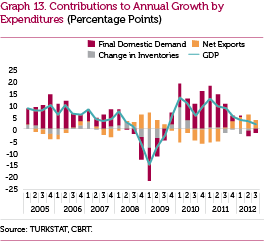
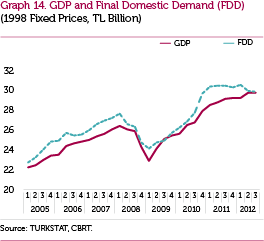
The global risk appetite has assumed a process of gradual recovery since early 2012, and the economy has become more stabilized. Monetary policy and macroprudential measures taken in this period decelerated credit growth, and the excessive appreciation in the TL was eliminated, leading the growth composition to change in favor of net exports. Final domestic demand has followed a flat course since the second half of 2011, while GDP has continued with a trend of growth amid the notable rise in the contribution of net exports (Graphs 13 and 14). Thus, the economy settled on a stabilization track and macro financial risks were contained.
Inflation
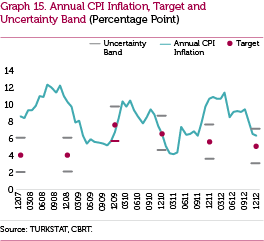
Inflation, which was 10.45 percent at end-2011, went down by 4.3 percentage points to 6.16 percent in 2012, hitting the lowest level of consumer inflation of the last 44 years. Effects of the depreciation in the TL across 2011 on inflation were almost completed in this period, which were mostly seen in durable consumption goods. The quite positive course of unprocessed food prices throughout the year compared to the past played a key role in the disinflation. The mild course of non‑agricultural international commodity prices throughout the year, the stable trend in exchange rates and the decelerating economic activity had favorable contributions in the inflation outlook. Thus, core inflation indicators displayed a downward trend all over the year amid the alleviation of cost and demand pressures. On the other hand, price and tax adjustments by the state especially in energy stood as a factor that deteriorated inflation. As a result, consumer inflation overshot the target of 5 percent by 1.2 percentage points in 2012, yet remained within the uncertainty band (Graph 15).
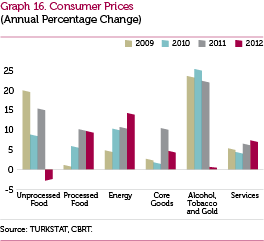
Analysis of the developments in 2012 by subgroups suggests that the most noteworthy development was the decline in unprocessed food prices compared to 2011. Moreover, the deceleration in core goods inflation besides the unchanged price level in tobacco products were also the main factors to support the fall in annual inflation (Graph 16). The high course of energy prices in 2012 was mainly driven by the effect of the decisions of the public sector. The Special Consumption Tax rate imposed on fuel oil was raised, and electricity and natural gas prices were increased. The adjustments by the state affected the consumer inflation by around 1 percentage point.
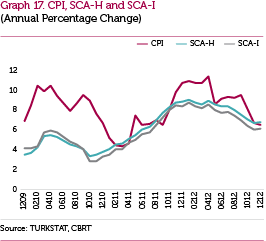
Both the annual growth rates and the underlying trend of core inflation indicators trended downwards across the year. In this period of flat course in services inflation, the deceleration in core goods prices proved influential (Graph 17).
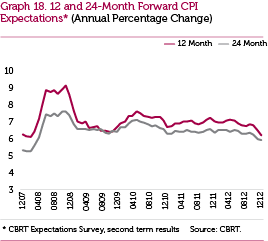
Medium-term inflation expectations, which remained flat during 2012, trended downwards at the year-end. Although consumer inflation hovered above 10 percent at the start of the year, inflation expectations did not deteriorate, which was attributed to the efficiency of the monetary policy (Graph 18).