MENU
MENU
PART 2 ACTIVITIES AND MAJOR DEVELOPMENTS
2.1 Price Stability, Financial Stability and Monetary Policy
2018 was a year of major shocks of differing dimensions. Thanks also to the coordinated policies in the first nine months of 2018, the Gross Domestic Product (GDP) posted a year-on-year increase by 4.5%. The Turkish economy recorded a gradual balancing in the first half of 2018. In the third quarter of the year, the uncertainty led by the depreciated Turkish lira coupled with the tightening financial conditions affected the domestic demand and the credit supply. On the other hand, the contribution of net exports to growth registered a considerable increase. The balancing in demand composition led to a rapid improvement in the current account deficit. Other factors that contributed to the real improvement in the current account balance are the brisk course of foreign demand, the robust recovery in revenues from tourism and other services and the ability of exporters to have access to alternative markets, which were boosted also by the increased competitive advantage.
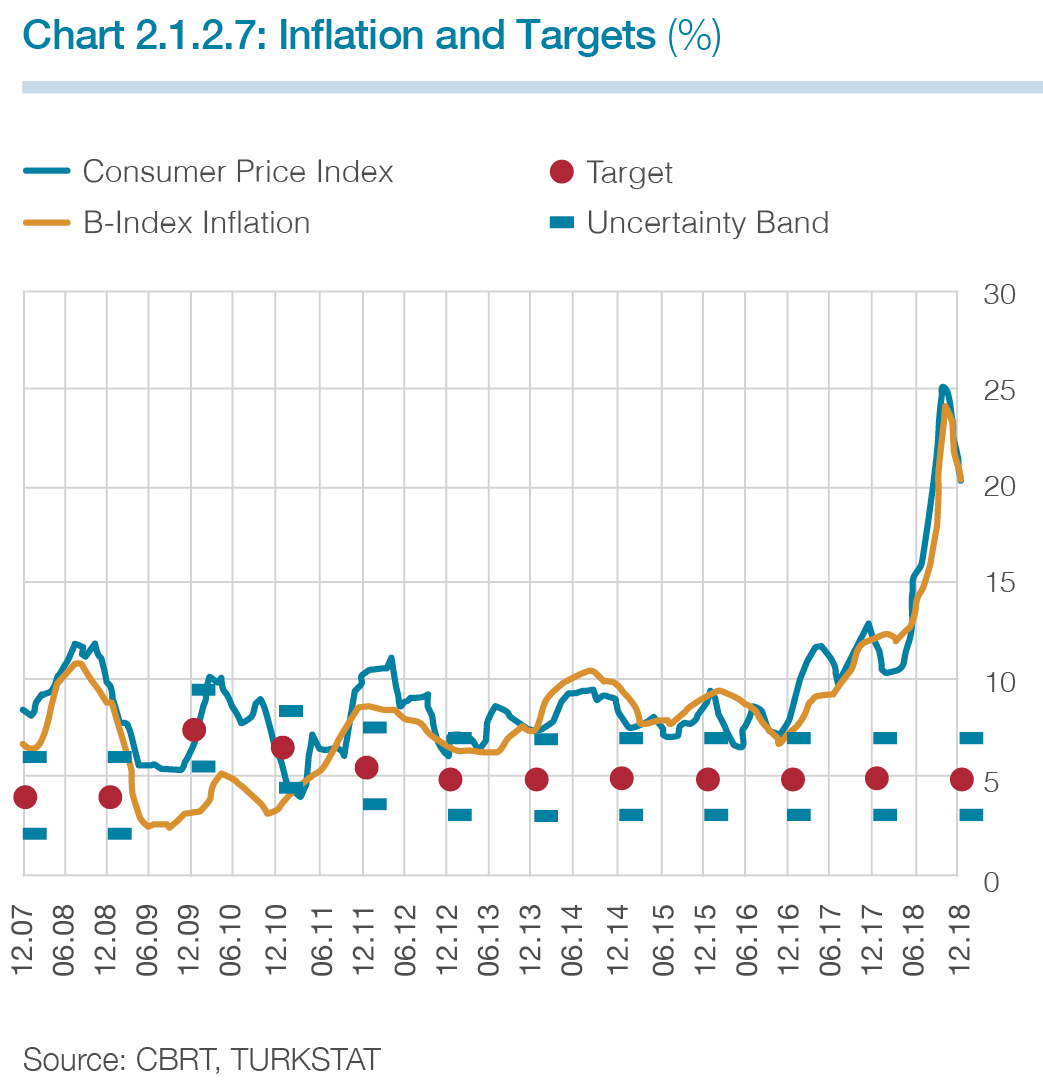
Consumer inflation posted an increase due to the depreciation in the Turkish lira and the resulting producer prices and the deterioration in the pricing behavior. Given the deteriorated pricing behavior coupled with the risks regarding the inflation prospects, a strong monetary tightening was delivered. Monetary measures and coordinated actions in economic policies allowed the pricing behavior to normalize in the last quarter, while the inflation outlook improved gradually. Thus, the partial appreciation in the Turkish lira and the developments in oil prices accompanied by subdued demand conditions in the last quarter drew inflation down to 20.30% at the end of the year. Meanwhile, the still-high inflation level coupled with the risks to price stability caused the tight monetary stance to be maintained.
In 2018, the simplification process was completed to bolster the efficiency of the monetary transmission mechanism in line with the monetary policy operational framework. In addition, actions were taken to enhance the efficient functioning of the markets considering the exchange rate volatility and unhealthy price formations and also to improve the transmission mechanism.
Monetary Policy Developments
The CBRT maintained the tight monetary policy stance of the first quarter of 2018 resolutely, and made a modest monetary tightening due to the persisting risks to the pricing behavior led by the high levels of inflation and inflation expectations in April, which were aggravated by the rise in import prices.
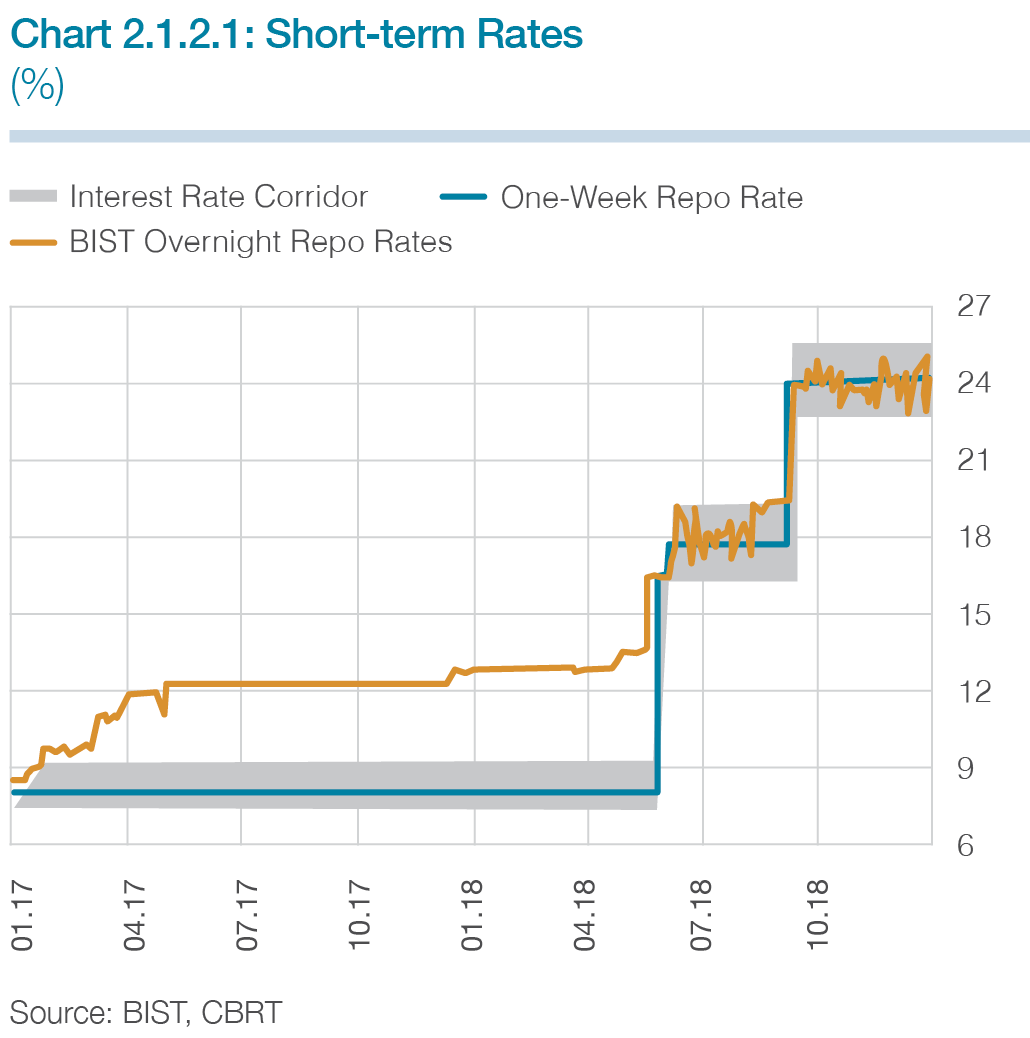
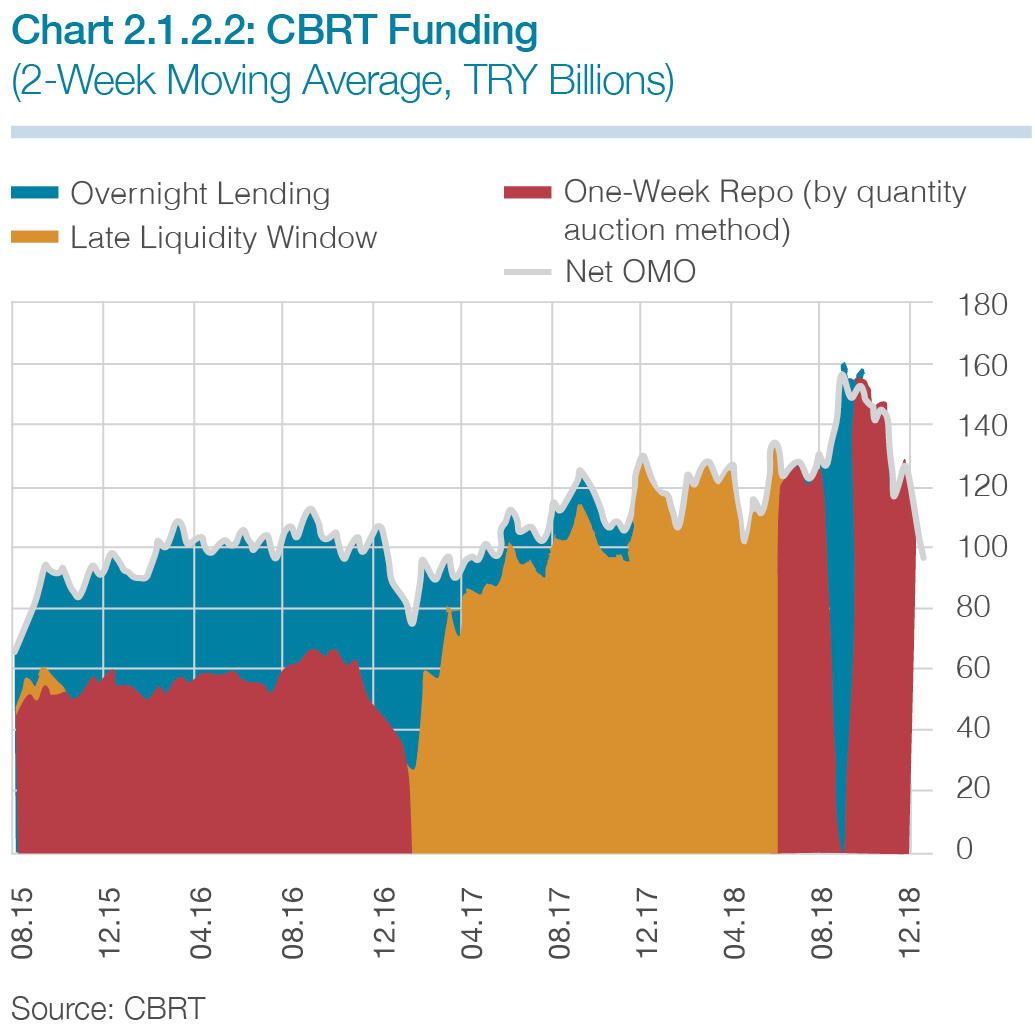
Given the risks carried by unhealthy price formations in the markets in May as well as the persisting rise in inflation expectations to the overall pricing behavior, an additional tightening was delivered. Besides this policy response, the CBRT completed the simplification process in the operational context of the monetary policy with a press release on 28 May 2018 to enhance the predictability of the monetary policy and to reinforce the transmission mechanism. Accordingly, the one-week repo auction rate became the CBRT’s policy rate. Moreover, it was decided that the CBRT’s overnight borrowing and lending rates would be set with a margin of +/- 150 basis points around the one-week repo auction rate (Chart 2.1.2.1). Thus, the overnight borrowing and lending rates formed a symmetrical corridor around the one-week repo auction rate. The whole of the CBRT funding started to be made through one-week repo auction rates in the new operational framework (Chart 2.1.2.2).
In the April-May period, in addition to the monetary policy decisions, the CBRT also took some measures for the markets. Accordingly, the upper limit for the FX facility ratio under the Reserve Option Mechanism (ROM) was reduced from 55% to 45%, and tranches were re-determined. This change provided the banks with FX liquidity, while conditions for TL liquidity grew tighter. Moreover, amounts of daily auctions for FX deposits against TL Deposits were raised. Through the press release of 25 May 2018, rediscount credits for export and foreign exchange earning services were enabled to be repaid in Turkish liras provided that they are paid at maturity. Alongside these measures on FX and TL liquidity management, the completion of the monetary tightening and the simplification process in May helped the volatility in financial markets to be alleviated.
In the June MPC Meeting, emphasizing that elevated levels of inflation and inflation expectations continue to pose risks to the pricing behavior, the CBRT opted for a stronger monetary tightening. Accordingly, the one-week repo auction rate, which is the policy rate, was raised to 17.75% from 16.5%. In the July MPC Meeting, given the slowdown in domestic demand conditions and the necessity to monitor the lagged effects of monetary policy, the policy rate was kept unchanged. Meanwhile, it was considered that the tight monetary policy stance may be extended for a long time as the elevated levels of inflation and inflation expectations remained as a risk factor against the pricing behavior.
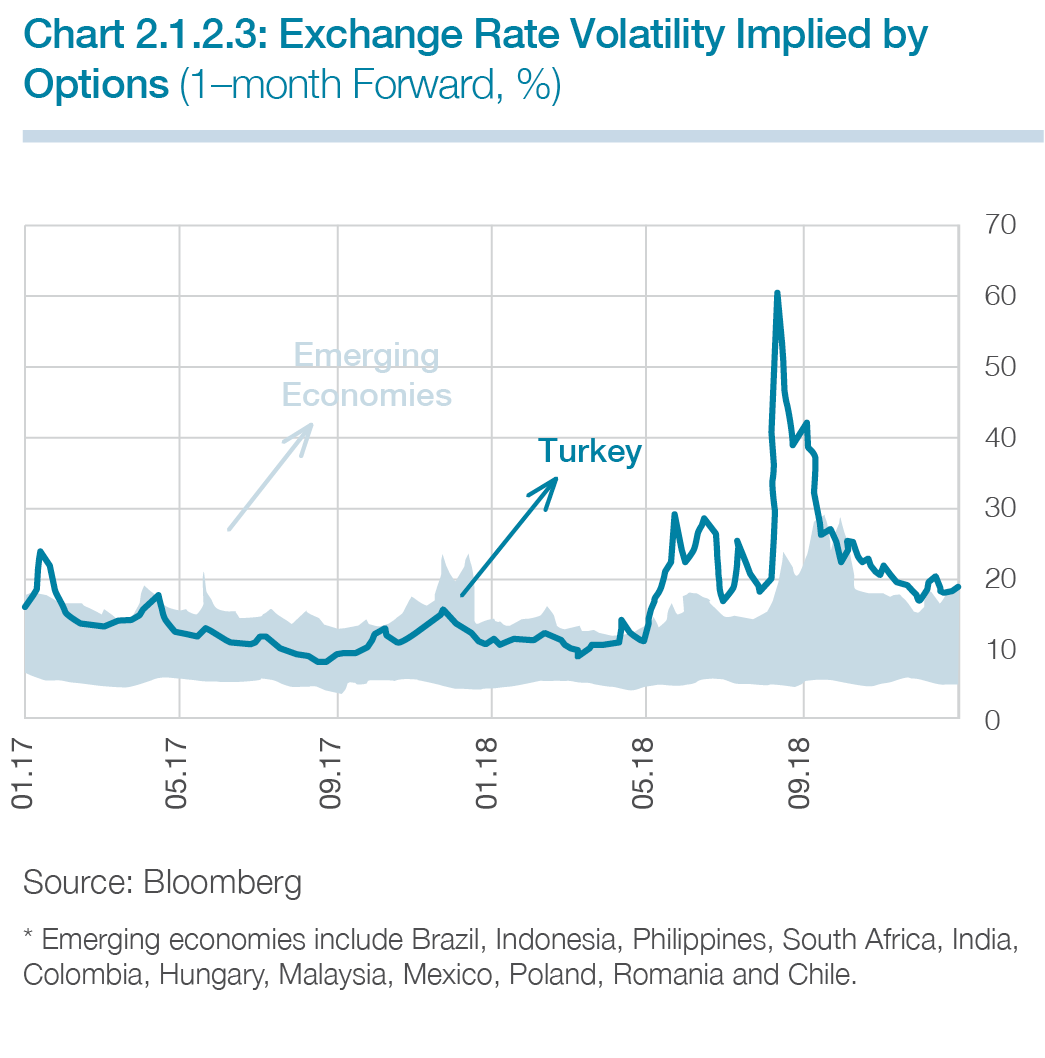
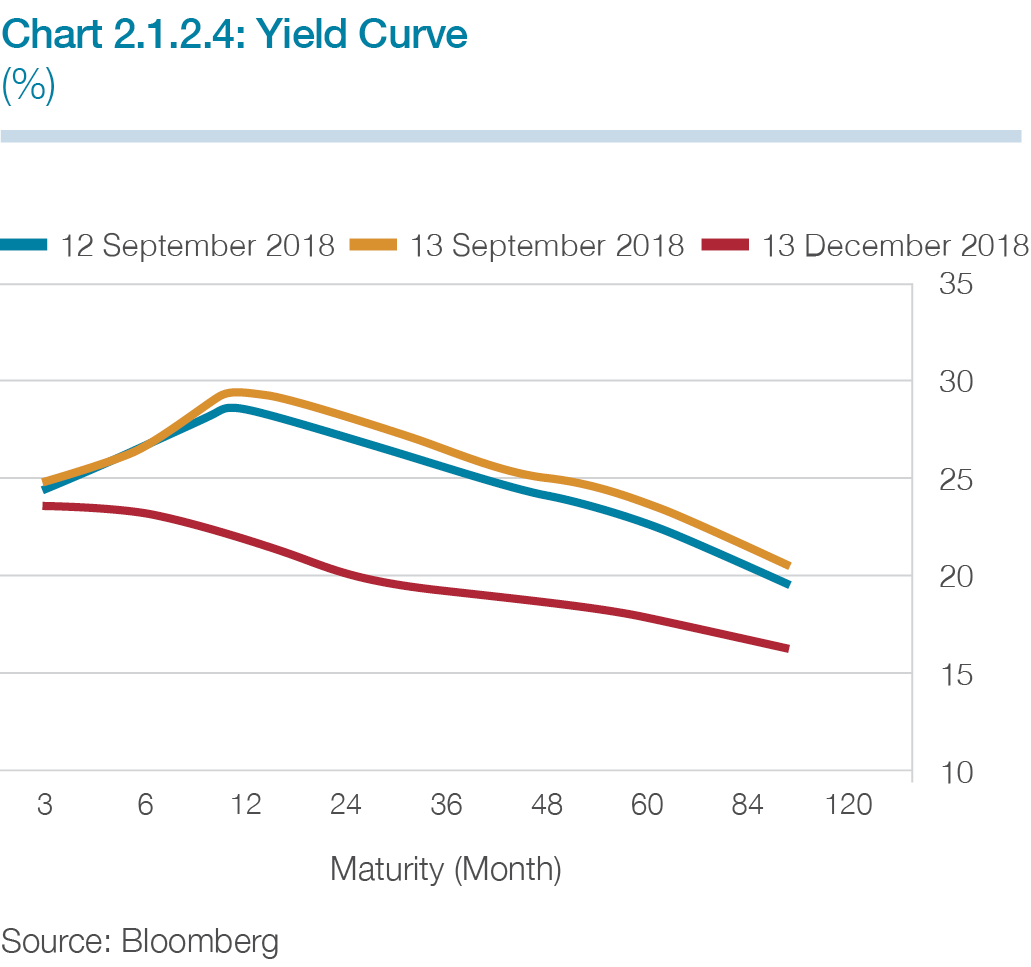
Against the rapid depreciation in the TL due to the excessive volatility in the exchange rate in early August, the CBRT took a series of measures to ensure smooth functioning of the markets focused on financial stability and supporting the TL and FX liquidity management. The upper limit was reduced for the foreign exchange facility under the ROM; the Turkish lira and foreign currency required reserve ratios were lowered and the markets were provided with liquidity; and flexibility was introduced to the banks’ conditions for collaterals. In this period of high volatility in financial markets, cost pressures and their secondary effects weighed on the inflation outlook. Accordingly, the CBRT opted for a strong monetary tightening in September to enhance price stability, and the one-week repo auction rate was raised to 24%. Owing to the measures and the strong monetary tightening decided on at the September MPC Meeting, the implied volatility for the Turkish lira receded in September and October in line with the decline in the risk premium and inflation compensation (Chart 2.1.2.3). Following the strong monetary tightening in September, a notable decline was seen in the long-term rates (Chart 2.1.2.4).
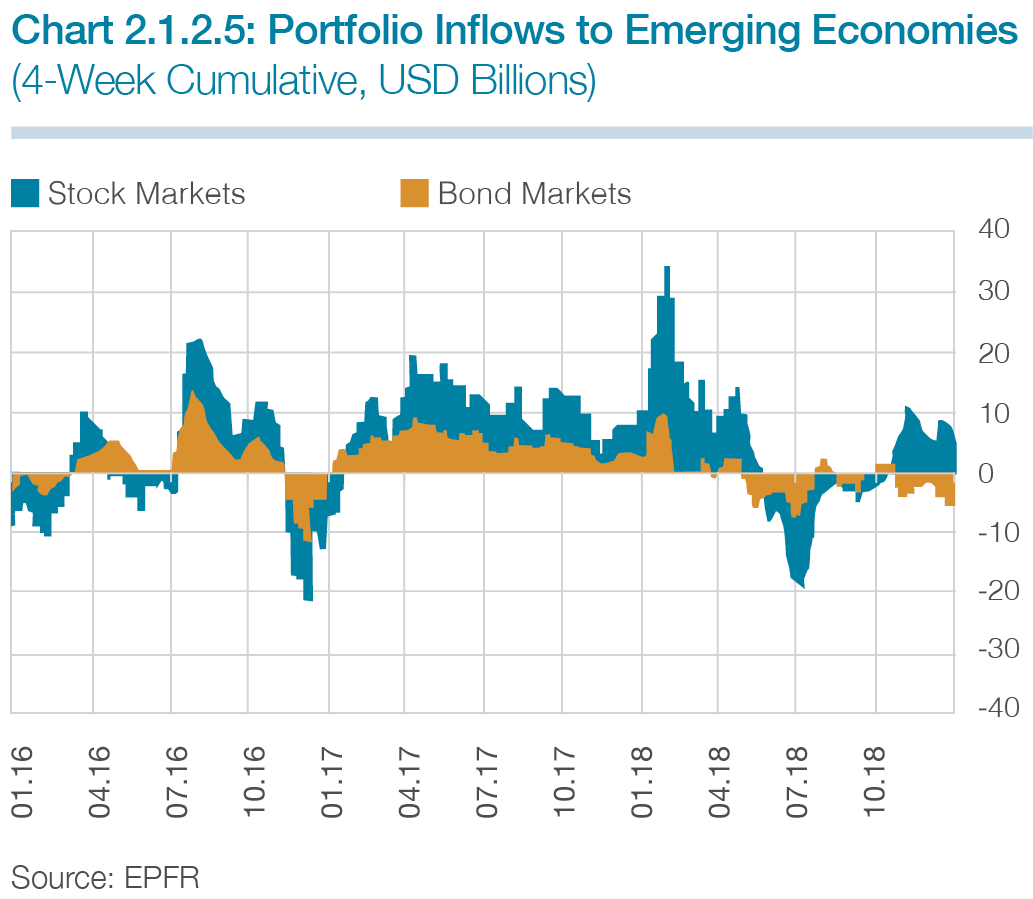
Normalization in the monetary policies of central banks of advanced economies continued throughout 2018. Alongside this development in global monetary policies, protectionism in international trade proved stronger, leading to increased volatility in global financial markets and emerging economies saw higher risk premiums but depreciated currencies. Portfolio inflows to emerging economies followed a fluctuating course (Chart 2.1.2.5). Portfolio inflows to Turkey displayed a similar trend and portfolio flows performed more weakly than past years due to geopolitical developments and the deterioration in the inflation outlook.
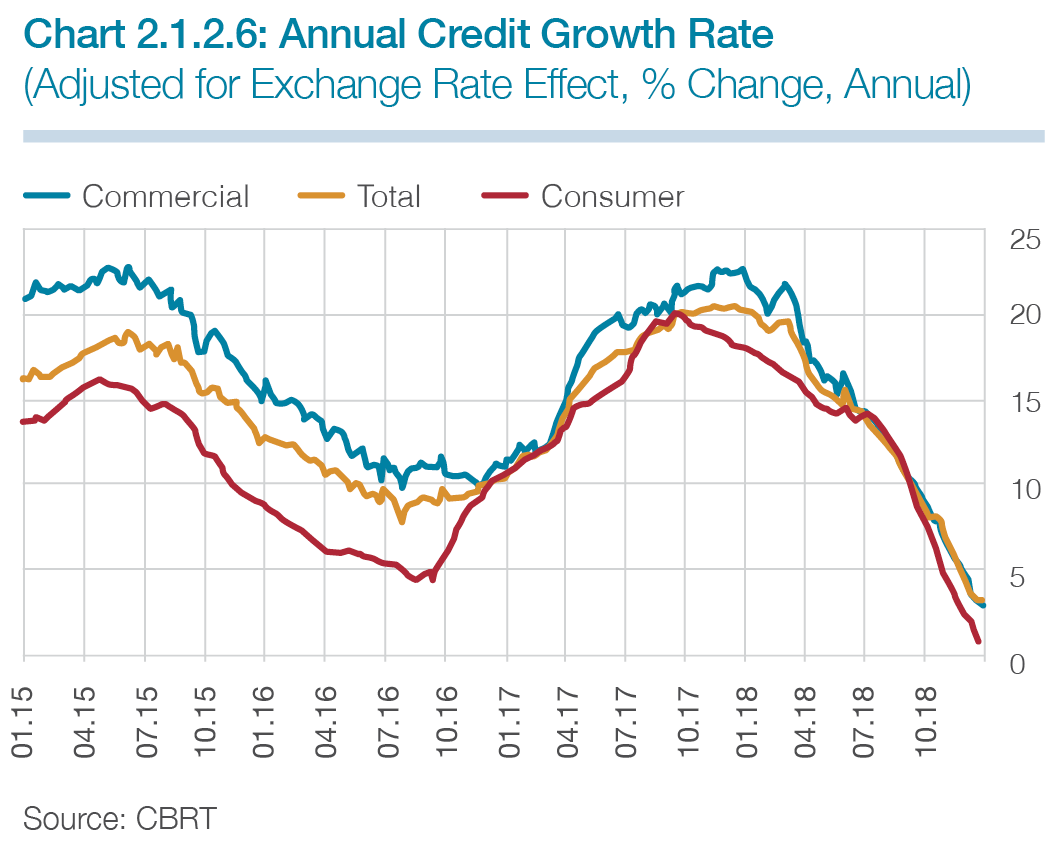
Total credit growth settled in a slower path as of the first quarter of 2018 and the credit growth rate maintained its downtrend across 2018 (Chart 2.1.2.6). In addition to the base effect led by the acceleration in the credit growth rate driven by the accommodative macroprudential policies and public finance measures and incentives of 2017, supply and demand dynamics also pulled the annual credit growth rate down. Credit supply was affected by the rising domestic and external funding costs and banks’ tightening of their credit standards. Subdued economic activity, sluggish investment demand and the rise in loan rates stood out as factors to reduce credit demand.
Inflation Developments
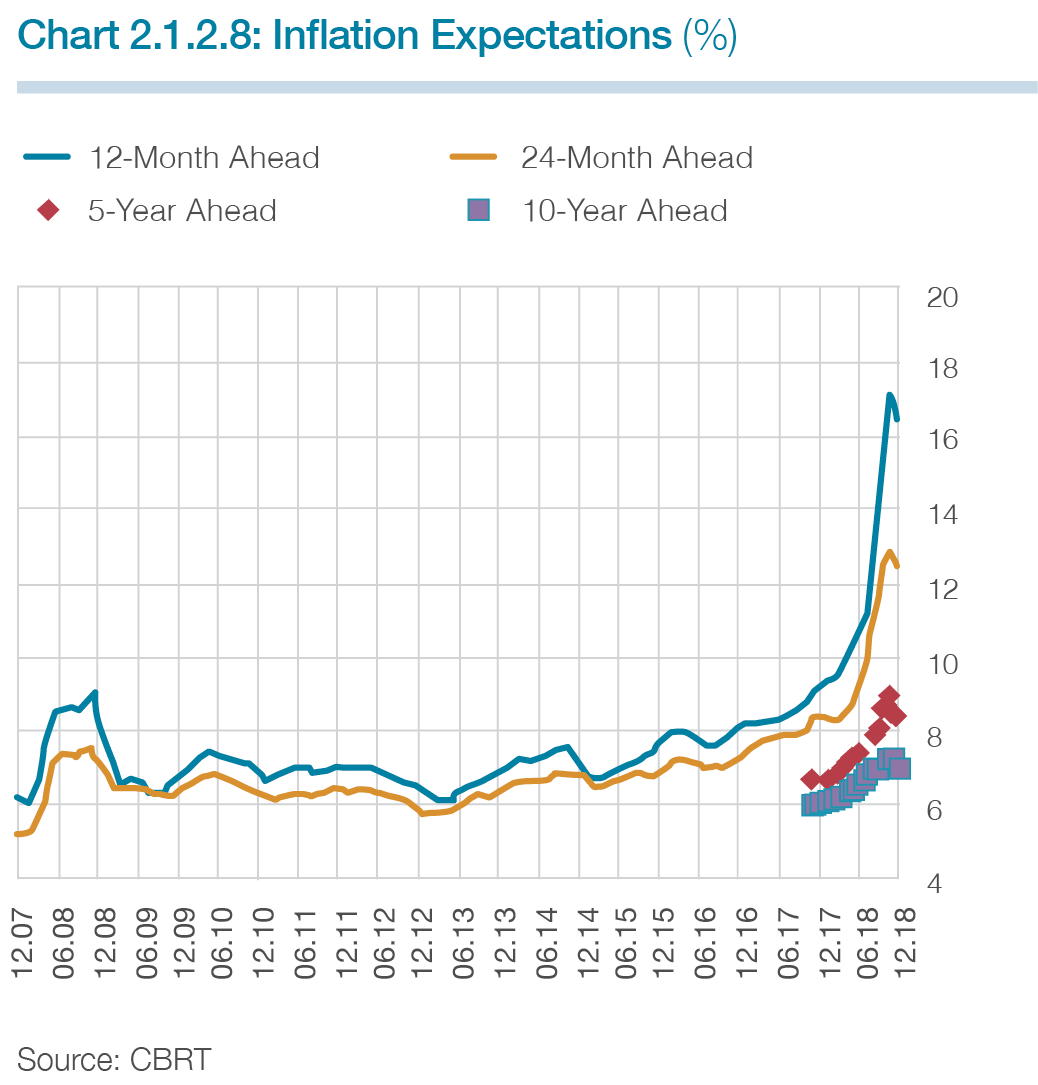
At the end of 2018, consumer inflation remained above the uncertainty band around the target at 20.30% (Chart 2.1.2.7). The sharp depreciation in the Turkish lira and the resulting deterioration in the pricing behavior stood out as the main drivers of the rise in inflation. Upon climbing to 33.64%, producer inflation kept cost-side pressures on consumer prices strong. Thus, consumer inflation posted a sharp increase since the second quarter and reached 25.24% in October. The uptick in inflation caused an increase in inflation expectations as well (Chart 2.1.2.8). In the last quarter, the deceleration in demand conditions, the decline in oil prices and the temporary tax adjustments in some durable goods all contributed to causing inflation to trended downwards and reach 20.30% at year-end.
Throughout 2018, especially core goods, which have relatively high and fast exchange rate pass-through, proved one of the drivers of the rise in inflation. Food prices stood out as another factor that stimulated the rise in inflation. Food inflation, which hit 13.79% at the end of 2017, lost pace in the first four months of 2018. However, in the following six months due chiefly to the cost pressures driven by exchange rate developments as well as unfavorable supply conditions in some products and the brisk course of tourism, food inflation saw high levels. In the last two months of 2018, food inflation decreased owing to the favorable prospects for fresh fruits and vegetables and the deceleration in processed food price increases and completed the year at 25.11%.
Annual services inflation recoded an increase due to the depreciation in the Turkish lira, more common past-indexation of inflation, stronger cost pressures in food and energy-related sectors and demand-side effects led by the brisk course of the tourism sector. Energy inflation, which followed a mild course in the first quarter compared to consumer inflation, gained momentum in the following months due to the sharp depreciation in the Turkish lira and the uptrend in oil prices. Adjustments in electricity and natural gas constitute a factor of pressure on energy inflation, while the sliding scale tariff put into use in fuel products in mid-May contained the price fluctuations.
Supply – Demand Developments, External Balance and the Labor Market
In 2017, the GDP growth posted a considerable year-on-year increase and stood at 7.4%. In this period, the main driver of growth was domestic demand due to the measures and incentives put into force. Due especially to the stronger domestic demand and rising imports owing to the developments in the gold trade, net exports offered a limited contribution to growth.
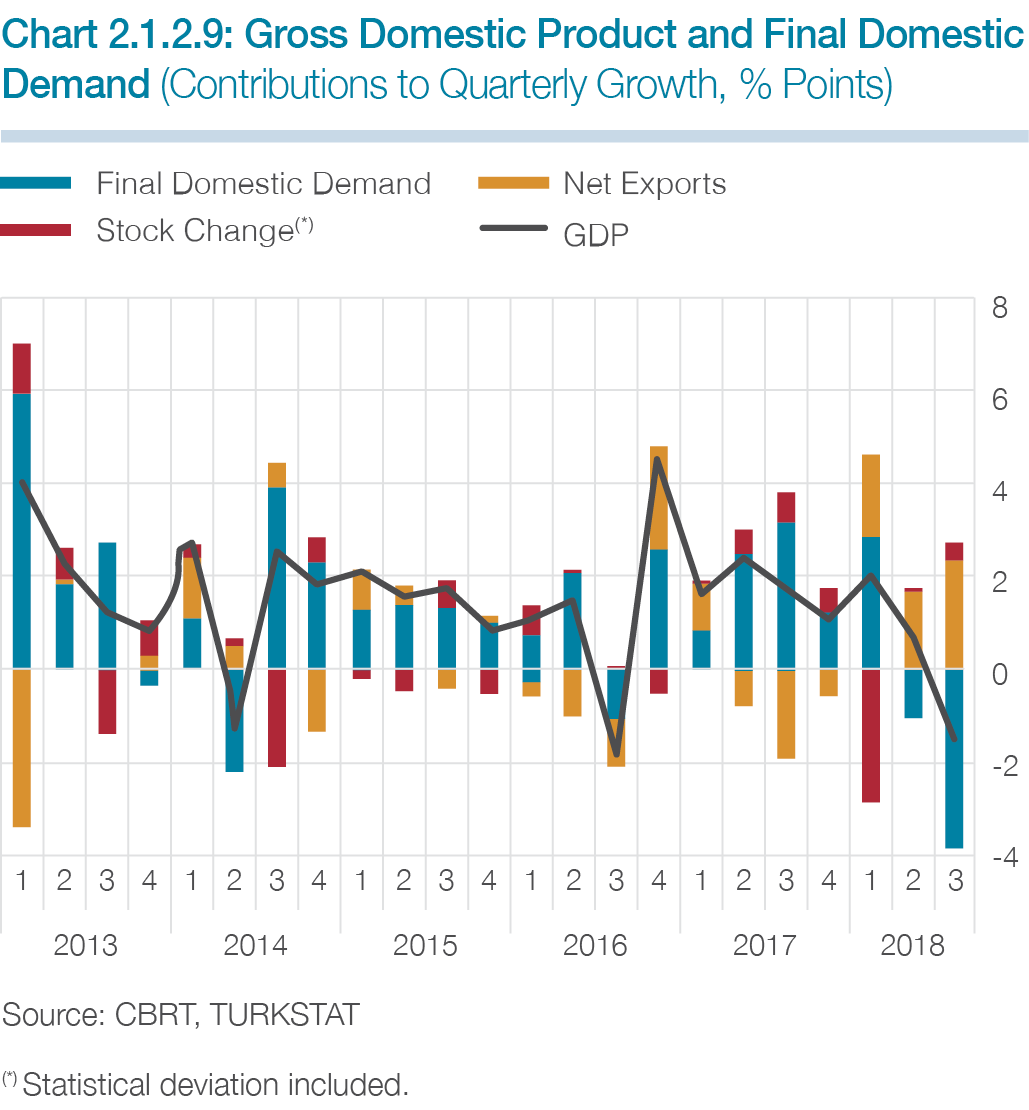
Economic activity, following the robust course in the first quarter of 2018, settled into a rebalancing process in terms of pace and composition in the second quarter and converged to the underlying trend. In the third quarter of 2018, due also to the volatility in financial markets in August, the slowdown in economic activity proved more pronounced particularly on the back of the domestic demand. Boosted by the brisk recovery in tourism and the fall in the import demand, the contribution of net exports to growth increased and the adverse effects of the final domestic demand were partially contained (Chart 2.1.2.9). Against these developments, GDP recorded a year-on-year increase by 4.5% in the first nine months of 2018.
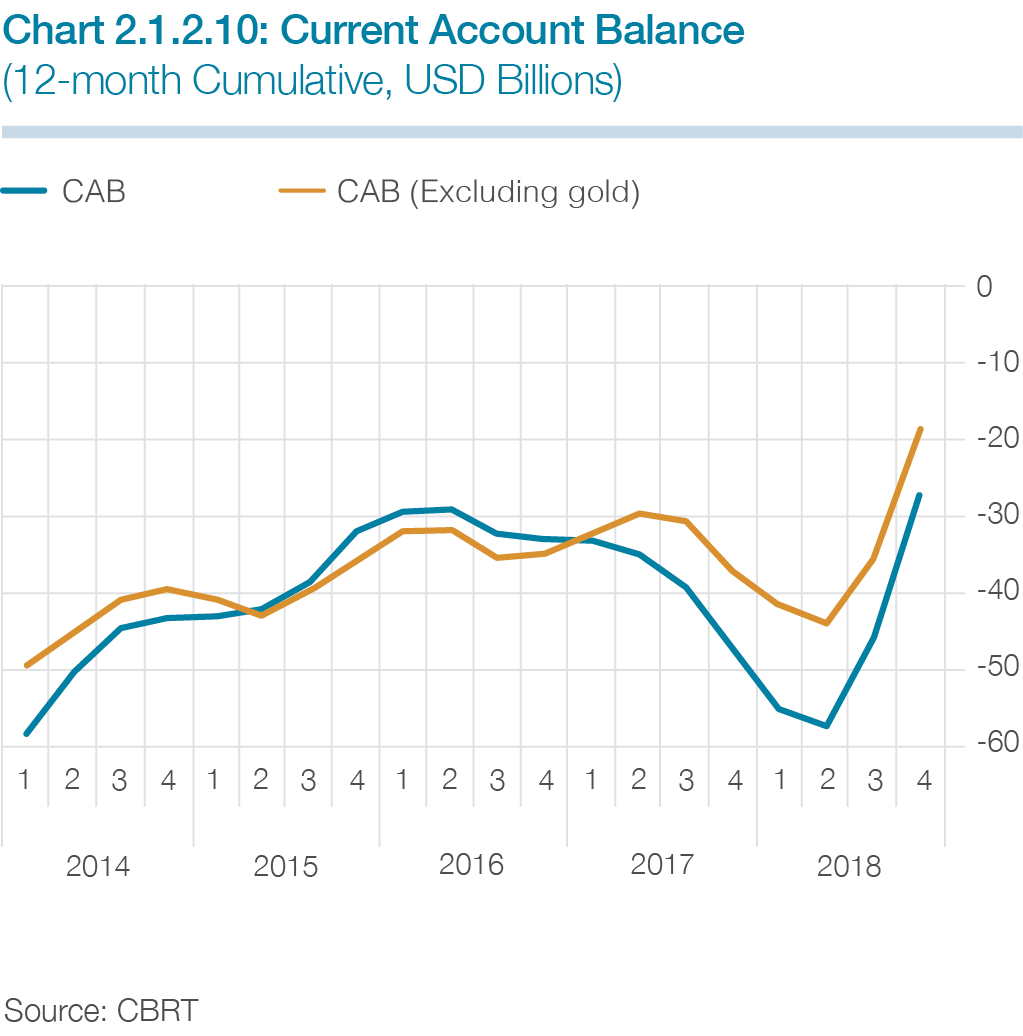
The current account balance recorded a notable improvement compared to the previous year (Chart 2.1.2.10). The rebalancing in foreign trade that started in the second half played an undeniable role in the narrowing of the current account deficit. Parallel to the favorable course of foreign demand, chiefly in the EU countries, exports remained on the increase across the year. Meanwhile, imports shrank in tandem with the economic activity, which has weakened since the second half of the year. Gold imports reverted to past averages, which contributed positively to the current account deficit. Tourism revenues maintain a steady increase, while transportation revenues, an item of services closely related to tourism, contributed to the improvement in the current account balance. On the other hand, the decline in oil prices in the last months of 2018 notwithstanding, the increase in energy prices across the year compared to 2017 had an adverse impact on the current account balance.
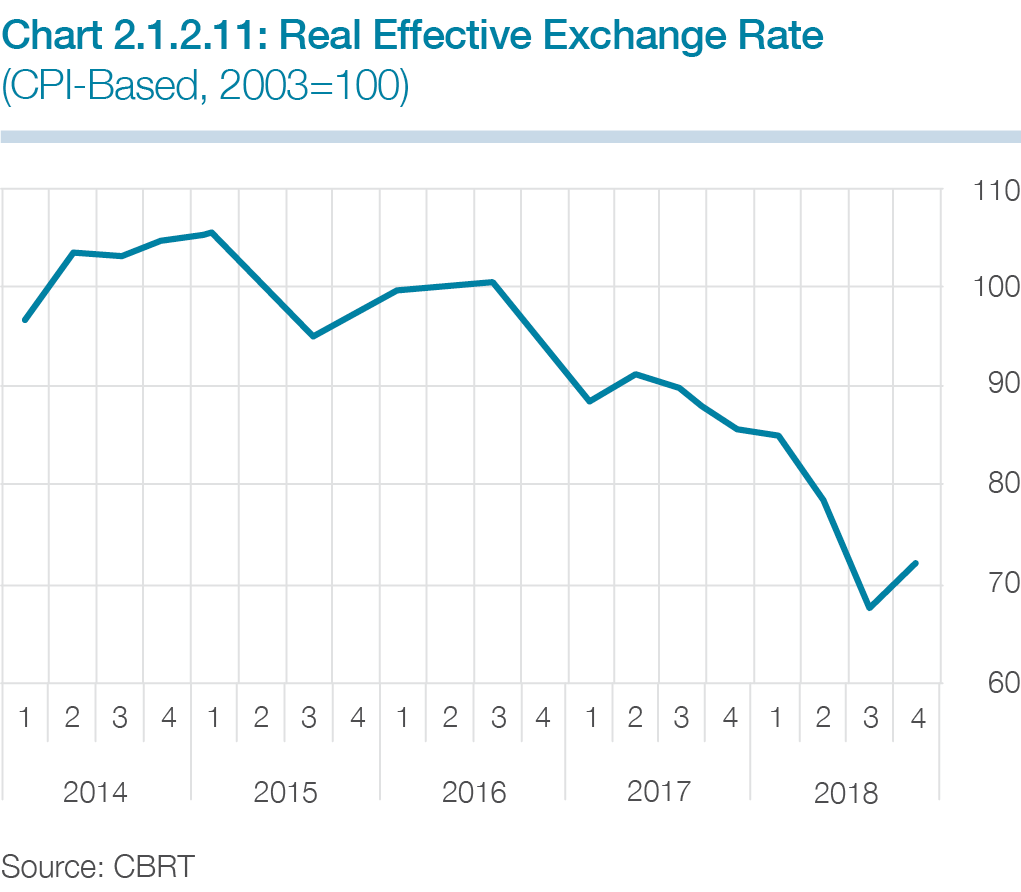
Across 2018, the average year-on-year decline in the real effective exchange rate stood at 14.4% (Chart 2.1.2.11). In addition to the weakening domestic demand and credits, the real depreciation in the exchange supported the decline in imports and contributed considerably to the rebalancing in the current account deficit.
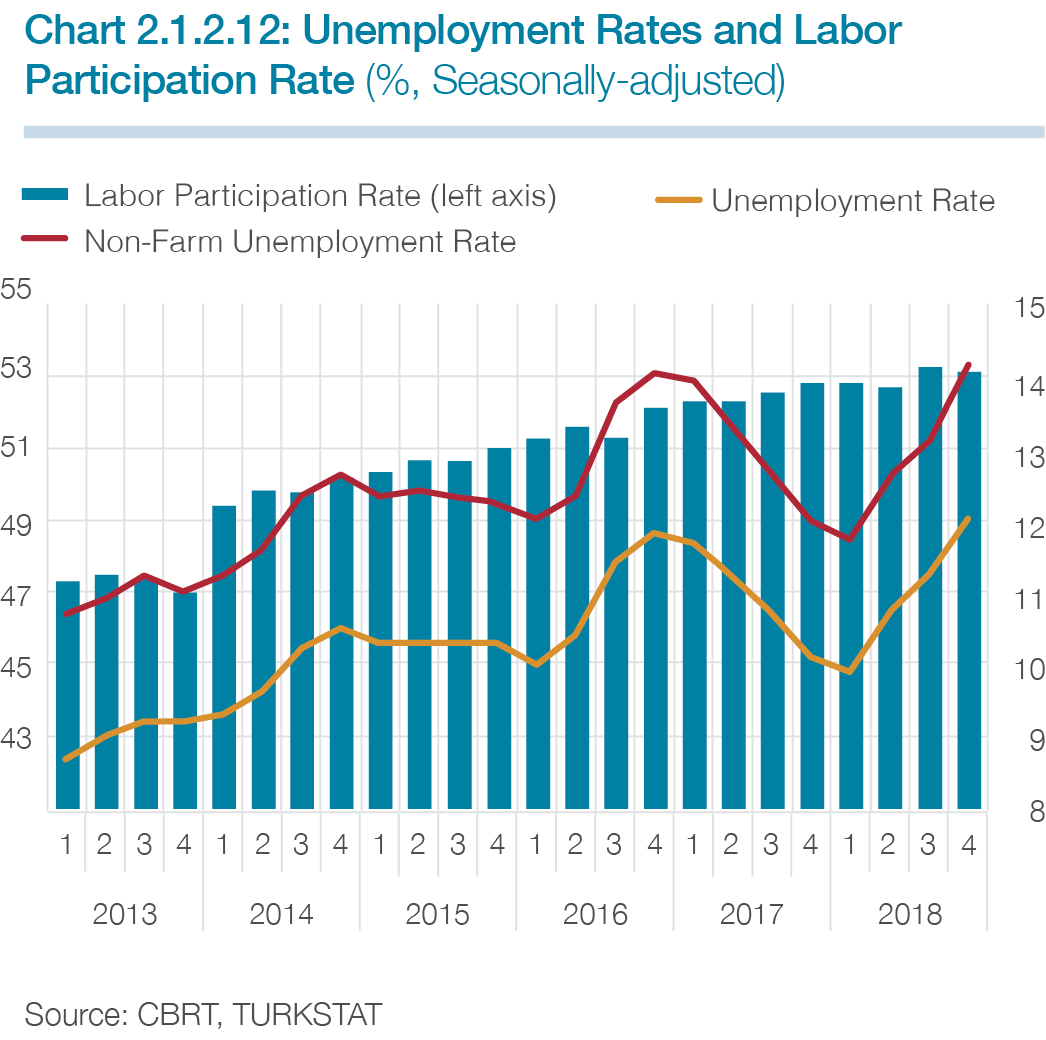
After receding across 2017, the unemployment rate trended upwards again as of the second quarter of 2018 and this trend in unemployment rates continued in the last quarter (Chart 2.1.2.12). This was led by the slowdown in economic activity coupled with the losses in employment in the non-farm sectors. Moreover, the rise in the labor participation rate also pushed unemployment rates upwards.