


2.1.2. Developments in 2015
Monetary Policy Developments
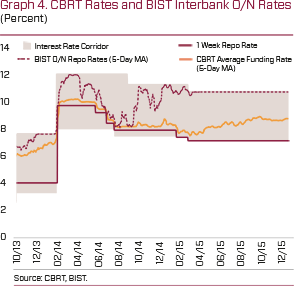
In view of the improving core inflation outlook, the CBRT implemented measured rate cuts in the first quarter of 2015. Yet, the Bank maintained the prudent monetary stance by tightening the liquidity policy simultaneously. In this context, the one-week repo auction rate was lowered from 8.25 to 7.75 percent in January and to 7.5 percent in February. Moreover, the overnight borrowing-lending corridor was shifted downward by about 50 basis points in February. The monetary stance remained tight the remainder of the year to avoid spillovers from the cumulative exchange rate effects to inflation. Accordingly, the borrowing-lending corridor was kept unchanged while the average funding rate was gradually hiked (Graph 4).
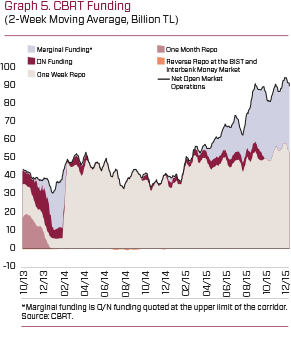
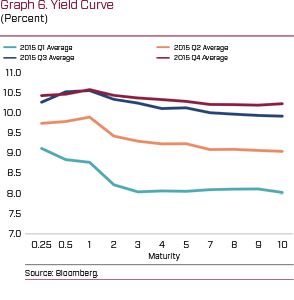
Meanwhile, the CBRT continued to provide funding mainly through one-week repo auctions, while the share of marginal funding was gradually increased over 2015 (Graph 5). The yield curve remained almost flat throughout 2015 (Graph 6).
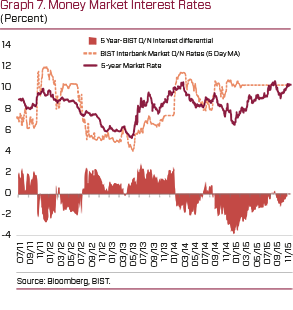
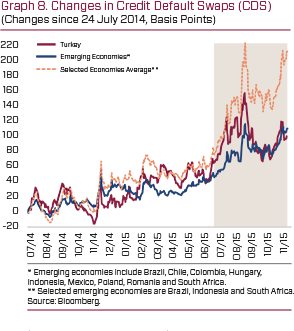
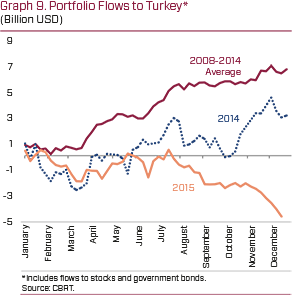
Despite rising long-term rates across the year, the 5-year market rates mostly remained below the Borsa İstanbul (BIST) interbank market overnight repo rates (Graph 7). On the other hand, heightened expectations of an end-2015 Fed rate hike amid normalizing global monetary policies caused the global risk appetite to remain low. Similar to other emerging economies, Turkey’s risk premium increased dramatically over 2015 (Graph 8). Hence, emerging economies faced portfolio outflows, while portfolio flows to Turkey diverged negatively from the average of previous years (Graph 9).
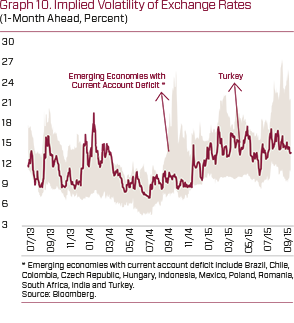
In the first half of 2015, the CBRT took several measures regarding foreign exchange liquidity due to the heightened exchange rate volatility (Graph 10). Starting from 27 February 2015, the amount of foreign exchange selling auctions has been set more flexibly. Additionally, on 10 March 2015, in order to meet the temporary foreign exchange liquidity needs of the banking sector and to reduce the TL-denominated intermediation costs, some technical adjustments were made to different tranches of the reserve option coefficients (ROC). Again, to this end, the remuneration rate for the required reserves maintained in TL was raised by 50 basis points at the MPC meeting in April, effective as of 8 May 2015. The Bank announced in the press release of 29 August 2015 that it would continue with such measures. Accordingly, these remuneration rates for required reserves were hiked by 50 basis points each in September, October and December. Furthermore, in order to lessen macrofinancial risks and to support prudential borrowing, the required reserve ratios applied to non-core FX short-term liabilities of banks and financing companies were raised to encourage banks to extend the maturity of their external borrowing. In addition, in view of the global interest rate developments, the rates applied to banks’ 1-week FX borrowings from the CBRT were reduced on 10 March and 24 April 2015, and again on 9 June and 27 July 2015.
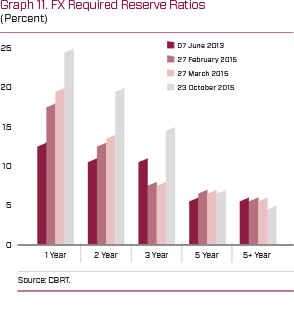
The expected normalization in the monetary policies of advanced economies in 2015 after a long time stood out as remarkable factor that weighed uncertainties in emerging economies. The CBRT published a road map on August 18 2015 regarding the policy measures to be enforced to avert the consequences of vague global monetary policies on financial markets. In this context, information was given on the interest rate policies and the amendments to be implemented in TL and FX liquidity policies and financial stability as well as the timing of these amendments. Accordingly, the CBRT announced that interest rate and TL liquidity policies would be simplified and the borrowing facility interest rate introduced to primary dealers would be terminated and the conditions for collaterals would be simplified. Additionally, the CBRT announced that following the normalization of global monetary policies, the interest rate corridor would be narrowed and be made more symmetrical around the one-week repo rate. Moreover, before and during the normalization of global monetary policies, the CBRT stated that alongside the measures to facilitate flexibility in the FX liquidity policies, additional steps would be taken to encourage core liabilities and longterm borrowing to enhance financial stability. Accordingly, the CBRT, with the announcement released on 29 August 2015, changed the reserve requirement ratios for new FX non-core liabilities of financial institutions to be formed after 28 August 2015 in a way to encourage the extension of maturities longer than three years (Graph 11). This change supports the extension trend in maturities of non-core liabilities (Graph 12).
Following the released road map, the borrowing facility interest rate through repo transactions offered to primary dealers was terminated on 23 September 2015. The Primary Dealership system was enforced through the support by an advantage in bid limits for one-week TL quantity auctions without changing the funding cost of primary dealers from the CBRT. Moreover, collateral conditions for TL transactions were simplified and the liquidity management of banks was made more effective starting from 28 September 2015. The CBRT confirmed that FX deposits can be used as collateral against TL transactions, and that this facility could be used as FX deposits with 1-month maturity. Further, interest rates to be paid to FX deposits would be announced and bankbased upper limits for the FX deposit amount as collaterals would be introduced.
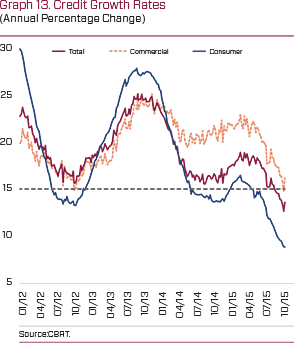
Owing to the CBRT’s tight monetary policy accompanied by the macroprudential measures implemented by the Banking Regulation and Supervision Agency (BRSA) regarding non-housing retail loans, the annual growth rate of loans extended to the non-financial sector remained weak in 2015 compared to previous years (Graph 13). Particularly, the BRSA’S practices coupled with the languishing consumer confidence almost the entire year led consumer loans to decline considerably. Against this background, the annual growth rate of total loans stood at reasonable levels.
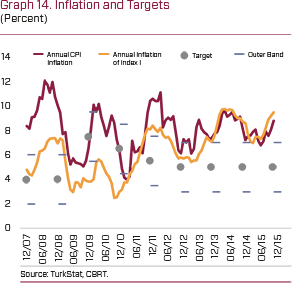
Inflation DevelopmentsIn 2015, annual inflation rose by 0.64 points compared to the previous year and stood at 8.81 percent by the year-end (Graph 14). The main reasons for the breach of the uncertainty band around the inflation target were the sizeable depreciation of the TL and the course of food prices. Meanwhile, the fall in import prices, particularly in oil, limited the rise in inflation throughout the year. Core goods prices surged due to the exchange rate movements. Services inflation also rose compared to the previous year due to cost increases fueled by the exchange rate and food prices. Accordingly, in an environment of a considerably mild course in energy prices, annual increase in main inflation indicators remained higher than headline inflation (Graph 14). In tandem with the rise in the trend of main inflation indicators, medium term inflation expectations also deteriorated throughout the year (Graph 15).
Considering the food price developments in recent years, it is evident that other measures, as well as monetary policy, are needed to curb inflation. Accordingly, the “Committee for Monitoring and Assessment of Food and Agricultural Products Markets”, at which the CBRT is represented by top management, progressed its studies in 2015. The Committee contributed significantly to the discussion of the developments in food prices at a common platform and served as an advisory body to recommend measures to be taken if required. Thus, in the course of the year, the Committee took some measures regarding some goods products, especially red meat.
National Income Developments, the Balancing Process and the Labor Market
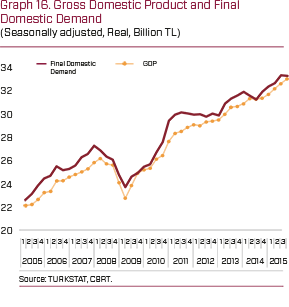
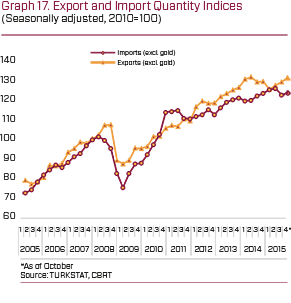
The growth rate in 2014 was down to 2.9 percent from 4.2 percent in 2013 owing to the tightening in financial conditions and macro prudential measures taken at the first quarter of the year. The consequent slowdown in final domestic demand (FDD) appeared mostly through the weak private consumption. Accordingly, the main contributor to the growth in 2014 was net exports thanks to developments in gold trade and a slowdown in imports as a result of weak domestic demand. Current data released by TurkStat shows that despite intensifying domestic and geopolitical uncertainties, growth accelerated in 2015 (Graph 16). The robust increase in private demand, mostly private consumption, plays the main role in this development. On the other hand, the balancing process on goods trade excluding gold is observed (Graph 17).
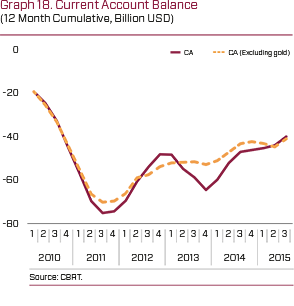
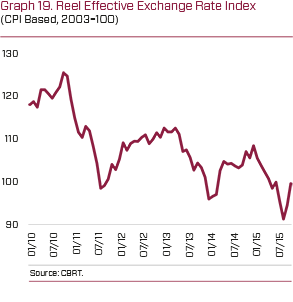
The improvement in the current account balance observed since 2014 continued gradually in 2015. The weak outlook of the global economy and adverse geopolitical developments that curtailed exports and moderate domestic demand that boosted imports stood out as the main developments which slowed down the improvement process in the first half of the year (Graph 18). However, in the second half of the year, the strengthening recovery in demand by European Union (EU) countries supporting export growth on the one hand, and imports assuming a downward trend on the other, contributed to the rebalancing process. As a result, the contraction in the current account deficit became more evident. In this process, the decline in energy prices, the favorable terms of trade developments and the moderate course of consumer loans were important factors providing support to the recovery. Moreover, the real exchange rate that appreciated gradually since the beginning of 2014, displayed a depreciation trend in the first nine months of 2015 due to the increase in the nominal exchange rates (Graph 19).
Despite the appreciation trend in the last quarter, the overall depreciation of the real exchange rate was 2.4 percent on average in 2015 and hovered around historically low levels.
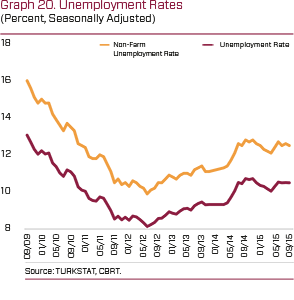
Unemployment rates trended upwards in the first nine months of 2015 compared to the same period of the previous year (Graph 20). The rise in the labor force caused unemployment rates to soar in this period (Graph 21). The rate of growth of nonfarm employment declined relative to the previous year. The sectoral analysis of non-farm employment indicates that the services sector continued to be the main driver of employment growth in the first nine months, while the rate of increase in industrial and construction employment is limited compared to 2014.