2.1 Price Stability and Monetary Policy
2.1.1 Overview
Gross Domestic Product (GDP) growth slowed in the first quarter of 2025 amid tight financial conditions. The contribution of private consumption and final domestic demand to annual growth declined. While exports of goods and services increased on a quarterly basis, and imports remained flat, thus net exports made a positive contribution to quarterly growth. Simultaneously with the release of second-quarter data, the Turkish Statistical Institute (TUKSTAT) made a major revision in national income statistics. Although growth exceeded forecasts during this period, private consumption and final domestic demand remained weak. Economic activity, which accelerated in the second quarter, slowed somewhat in the third quarter, displaying a growth close to its quarterly potential. Private consumption, which had declined on a quarterly basis in the first two quarters, increased in the third quarter, while total investments continued to support growth. In the third quarter, there was a decline in imports of goods and services and an increase in exports on a quarterly basis. Consequently, net exports made a positive contribution to quarterly growth.
In the final quarter of the year, while the quarterly growth in private consumption accelerated compared to the previous quarter, the quarterly contribution of investments turned negative due to a decline in machinery and equipment investments. During this period, exports of goods and services decreased, while imports of goods and services increased. Thus, net exports made a dampening contribution to quarterly growth. Against this backdrop, throughout 2025, amid tight financial conditions, private consumption’s contribution to growth remained limited, similar to the previous year, while total investments increased their contribution. The contribution of net exports was negative and constrained growth. In this context, in 2025, economic activity remained moderate on an annual basis, with a growth rate of 3.6%. As for production, the services sector was the main driver of growth throughout the year, while the industry and construction sectors also contributed positively to growth. Agricultural added value declined due to the impact of reduced crop production caused by frost and drought.
Although the economic activity in Türkiye’s main trading partners exhibited a weak and fragile outlook throughout the year, exports continued to increase on an annual basis in 2025. Nevertheless, the trade deficit rose in annual terms, driven by an increase in gold imports and rise in core imports. During this period, the strong outlook in the services balance continued to support the current account balance.
As a result of these developments, the current account deficit increased year-on-year to USD 30.1 billion in 2025. Thus, the current account deficit-to-GDP ratio stood at 1.9%, reflecting a moderate trend below the historical average.
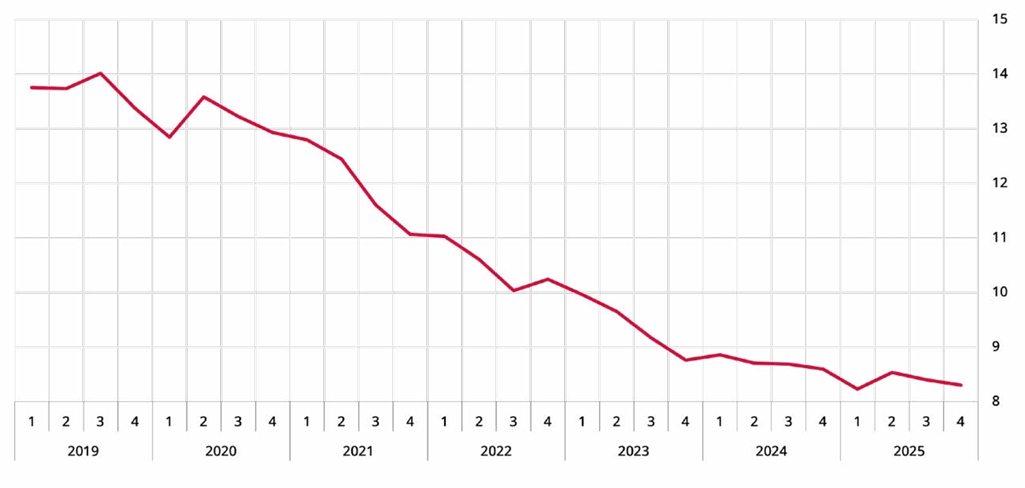
Key labor market indicators suggest that the labor market remained strong. The total employment remained almost flat throughout the year. The unemployment rate fell by 0.4 percentage points year-on-year, falling to 8.4%.
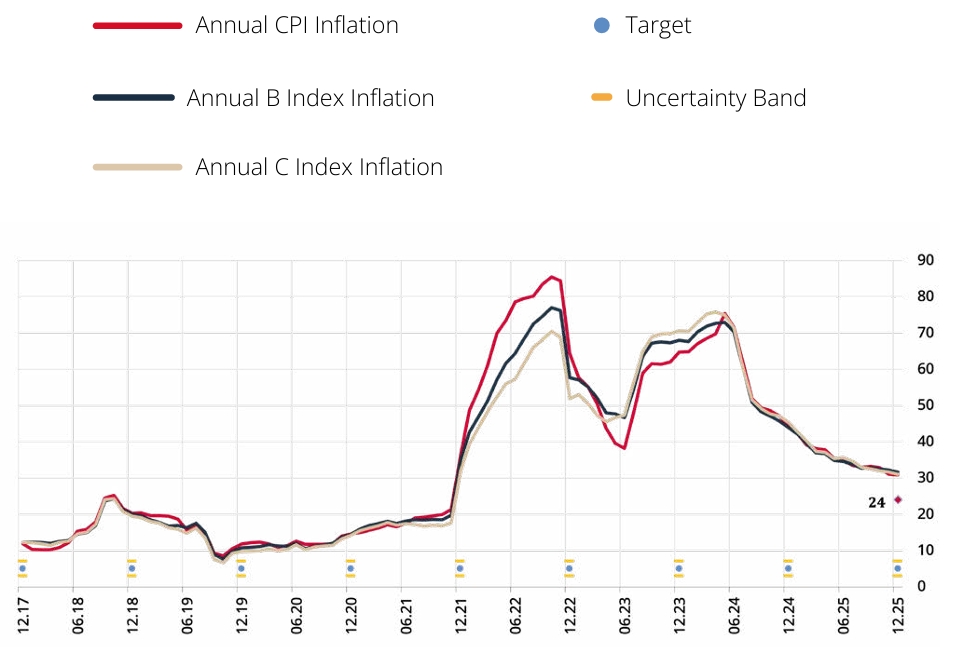
The disinflation process continued in 2025 as well. Throughout the first half of 2025, falling commodity prices -particularly oil prices supported the decline in inflation. Due to developments in financial markets, the Turkish lira depreciated in March and April, and the effects of this were observed not only on core goods inflation but also on producer prices. The Consumer Price Index (CPI) fell by 13.5 percentage points year-on-year, ending the year at 30.9 percent—at the lower bound of the forecast range presented in the final Inflation Report of 2025. At end-2025, annual inflation in the core B and C indicators fell by 12.3 percentage points and 14.3 percentage points year-on-year to 31.7% and 31.1%, respectively. Despite a limited improvement, inflation expectations remained above inflation forecasts and interim targets. Annual producer prices inflation, which had been declining until May, displayed an upward trend thereafter. Throughout the year, the impact of geopolitical developments and tariff changes, as well as seasonal increases in metal prices was observed on producer prices. However, the decline in transportation costs and supply chain pressures hovering close to historical averages served as factors limiting cost pressures. On the back of these developments, annual producer price inflation ended 2025 at 27.7%, remaining below the annual CPI inflation rate.
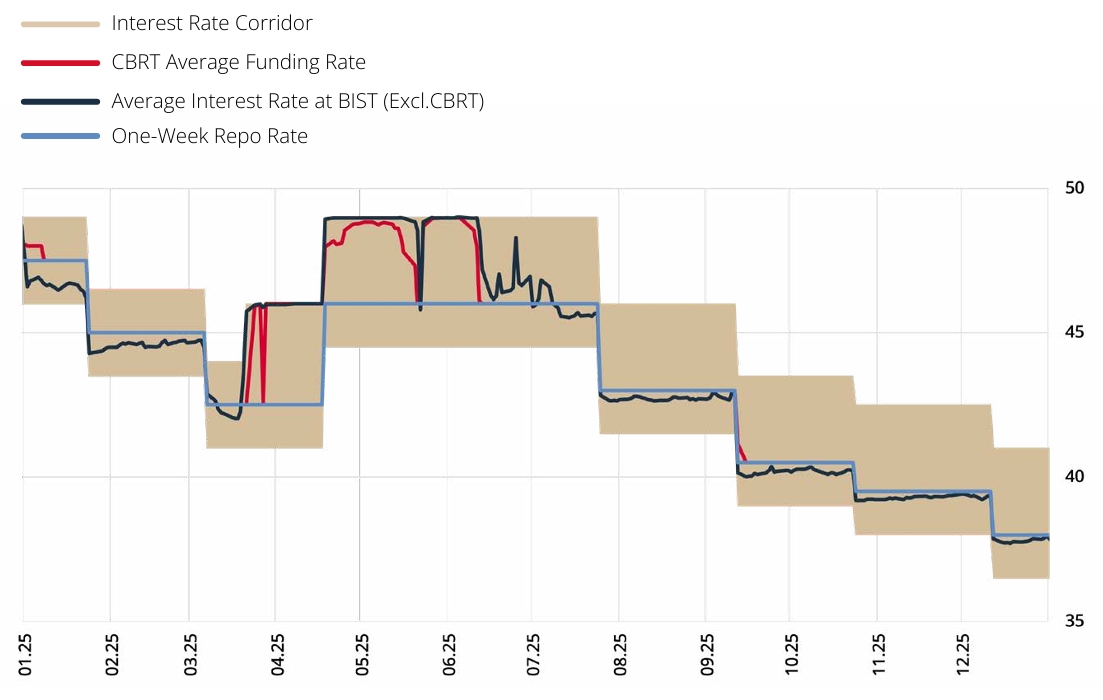
The CBRT cut the policy rate by a total of 500 basis points in January and March 2025, bringing it to 42.5%. To limit the risks that developments in financial markets could pose to the inflation outlook, the CBRT decided at an interim Monetary Policy Committee (MPC) meeting held on March 20, 2025, to raise the overnight lending rate to 46%, while keeping the policy rate and the overnight borrowing rate unchanged. Moreover, one-week repo auctions were suspended for a period, and funding was provided at the overnight lending rate. In April, highlighting the impact of developments in financial markets on the underlying trend of inflation, the CBRT raised the policy rate to 46%; the overnight lending rate to 49%, and the overnight borrowing rate to 44.5%, and announced that one-week repo auctions would be resumed. The CBRT kept the policy rate unchanged in June, but cut the policy rate by a total of 800 basis points in subsequent meetings and brought it down to 38% in December. To enhance the effectiveness of monetary transmission in the face of diverging expectations among economic agents and potential volatility, the CBRT continued to implement macroprudential policies in 2025 as well.
2.1.2 Developments in 2025
Monetary Policy Developments
The CBRT reduced the policy rate, which was 47.5% at the end of December 2024, to 45% in January 2025 with a 250-basis-point cut. The CBRT stated that despite some signs of improvement in inflation expectations and pricing behavior, they continued to pose a risk to the disinflation process, and emphasized that a tight monetary policy stance would be maintained until a sustained decline in inflation and price stability were achieved. Furthermore, the CBRT stated that the policy rate would be determined taking into account realized and expected inflation and its underlying trend in a way to ensure the tightness required by the projected disinflation path in line with the interim targets.
The CBRT cut the policy rate by 250 basis points in March. Moreover, the CBRT held an interim meeting in the same month to evaluate the developments in financial markets. At the MPC interim meeting of March 20, the risks that developments in financial markets could pose to the inflation outlook were assessed and a set of measures were taken to support the tight monetary stance. Accordingly, the CBRT decided to raise the overnight lending rate from 44% to 46%, and to keep the policy rate and overnight borrowing rate unchanged at 42.5% and 41%, respectively. Moreover, the one-week repo auctions were suspended and funding started to be provided at the overnight lending rate.
In April, drawing attention to the effects of developments in financial markets on underlying inflation, the CBRT raised the policy rate from 42.5% to 46%, the overnight lending rate from 46% to 49%, and the overnight borrowing rate from 41% to 44.5%. Moreover, the CBRT announced that one-week repo auctions would be resumed. The CBRT stated that inflation expectations and pricing behavior continued to pose risk to the disinflation process and potential effects of the rising protectionism in global trade on the disinflation process through global economic activity, commodity prices and capital flows would be closely monitored. The CBRT affirmed that the policy rate would be determined taking into account realized and expected inflation, and the underlying trend, and that it would act prudently on a meeting-by-meeting basis in a way to ensure the tightness required by the projected disinflation path.
The CBRT, assessing that the downward trend in inflation—which had started in May—continued in June, kept the policy rate unchanged at 46% in June. In July, noting that the disinflationary impact of demand conditions had increased, the CBRT lowered the policy rate from 46% to 43%. However, the CBRT emphasized that inflation expectations and pricing behavior continued to pose risks to the disinflation process, and stated that it was closely monitoring the potential effects of geopolitical developments and rising protectionism in global trade on the disinflation process. Furthermore, the CBRT stated that all monetary policy tools would be used effectively in case a significant and persistent deterioration in inflation was foreseen.
Based on the assessment that the underlying trend of inflation slowed down in August and demand conditions were at disinflationary levels, the CBRT lowered the policy rate from 43% to 40.5% in September. At its October meeting, the CBRT noted that the core inflation trend had risen in September and that while demand conditions remained at disinflationary levels, the disinflation process had slowed. It emphasized that risks posed by price developments—particularly in food—to the disinflation process through inflation expectations and pricing behavior had become more pronounced. In light of these developments, the CBRT implemented a modest cut in October, bringing the policy rate to 39.5%. Additionally, it was stated that decisions regarding the policy rate would be reviewed prudently with meeting-by-meeting basis with a focus on inflation; it was also noted that if the inflation outlook deviated significantly from the interim targets, the monetary policy stance would be tightened. Assessing that the underlying trend of inflation had moderated somewhat in October and November following the increase in September, the CBRT decided at its December meeting to lower the policy rate from 39.5% to 38%. Stating that liquidity conditions would continue to be closely monitored and liquidity management tools would be used effectively, the CBRT indicated that it would support the monetary transmission mechanism with additional macroprudential measures in case of unanticipated developments in credit and deposit markets.
In 2025, simplification measures continued with the aim of enhancing the functionality of market mechanisms, strengthening macrofinancial stability, and supporting the monetary transmission mechanism. The most significant step taken in this context was the termination of new openings and renewals of FX-Protected Deposit (KKM) accounts, and consequently, the removal of all targets related to KKM renewals and the transition to the Turkish lira. Measures aimed at increasing the share of Turkish lira deposits within total deposits and gradually reducing and phasing out KKM accounts supported the monetary policy stance in 2025.
With the aim of strengthening the monetary transmission mechanism by also monitoring the development of Turkish lira funding channels other than deposits, the reserve requirement ratios applied to Turkish lira-denominated loans obtained from abroad and funds raised through foreign repo transactions have been increased across maturities. The temporary measure of applying a zero percent reserve requirement to increases in foreign currency liabilities obtained from abroad with a maturity longer than 1 year was terminated. Foreign currency reserve requirement ratios were reviewed and the reserve requirement ratios for deposits and participation funds denominated in foreign currency and precious metals were equalized, while the reserve requirement ratios for other foreign currency liabilities with maturities over one year were reduced. Policies regarding credit growth were effectively utilized in 2025 to support the monetary policy transmission mechanism and ensure balance in domestic demand.
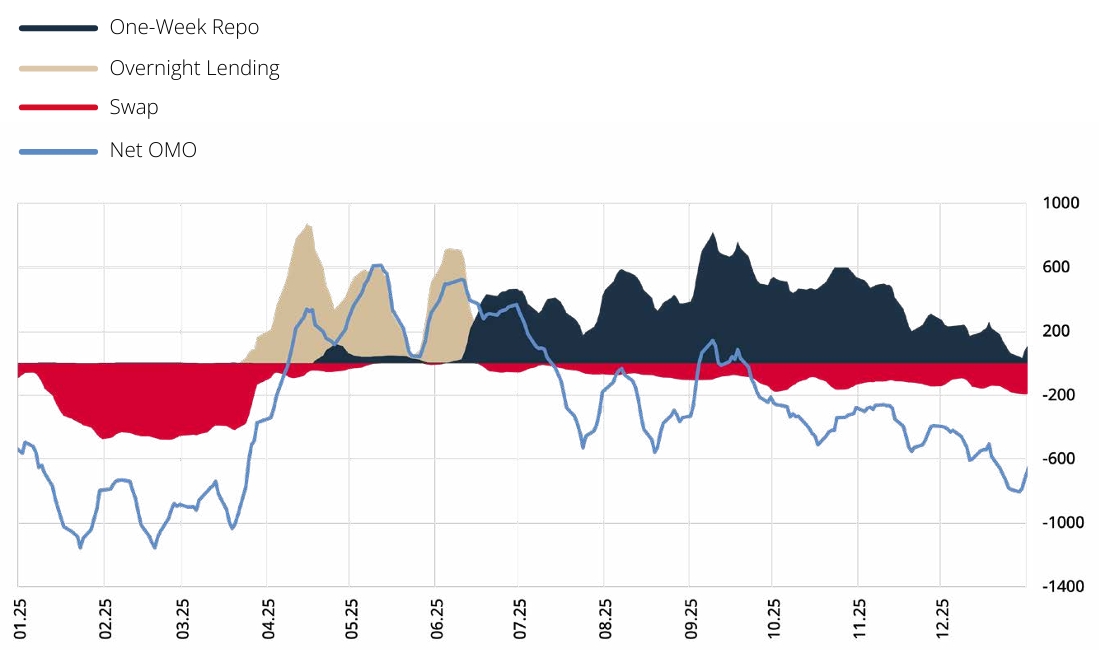
While the excess liquidity in the system was TRY 846 billion at the beginning of 2025, a temporary liquidity shortage emerged in the system between April and July. Between March 20 and April 17, one-week repo auctions were suspended in light of developments in financial markets. The excess liquidity, which began to become permanent starting in early July, stood at TRY 653 billion as of December 31, 2025 (Chart 2.1.2.2). Of this excess liquidity, TRY 461 billion was sterilized through net Open Market Operations (OMO) and TRY 192 billion through swap transactions. The TRY 192 billion decrease in excess liquidity level in 2025 stemmed from changes in the monetary base, particularly from reserve requirements. Moreover, the increase in the Ministry of Treasury and Finance’s net domestic borrowing played a role in the decline of excess liquidity in the system.
In 2025, the excess liquidity in the system was sterilized using various instruments to enhance the effectiveness of the monetary transmission mechanism. In this context, the CBRT primarily conducted Turkish lira deposit buying auctions, Turkish lira swap auctions involving the sale of foreign currency or gold, and deposit operations in the Interbank Money Market (IMM). Moreover, liquidity certificates were issued as part of the sterilization toolkit. In this context, a total worth of TRY 269 billion in liquidity certificates with a maturity of approximately one month was issued between March 24, 2025 and April 4, 2025. The effectiveness of sterilization operations was supported by a comprehensive set of liquidity tools. Consequently, interest rate volatility in money markets has decreased significantly (Chart 2.1.2.1).
Chart 2.1.2.1: Short-term Interest Rates (%)
Kaynak: BIST, CBRT.Last Observation: December 2025
Chart 2.1.2.2: CBRT Funding (One‑Week Moving Average, TRY Billion)
Source: CBRT.Last Observation: December 2025
Inflation Developments
The disinflationary trend that began in June 2024 continued across 2025. Throughout the first half of 2025, falling commodity prices—chiefly oil prices—supported the decline in inflation. On the other hand, unfavorable weather conditions in the February-April period exerted pressure on food prices. As the Turkish lira depreciated in March and April amid developments in financial markets, the resulting effects were evident not only in core goods inflation but also in producer prices. Global prices rose in June, led by energy prices, due to geopolitical tensions, but fluctuated in the third quarter. Geopolitical developments had adverse impacts both on consumer prices and producer prices. In the third quarter, consumer inflation was shaped mostly by the upward effects of the revisions introduced to lump-sum taxes and administered prices. In the fourth quarter of the year, annual consumer inflation continued its downward trend. In December, the underlying trend displayed a marked improvement, with headline inflation falling by 13.5 percentage points compared to the previous year. Thus, annual consumer inflation closed the year at 30.9%, at the lower bound of the forecast range presented in the 2025 Inflation Report (Chart 2.1.2.3). Annual inflation in the B and C core inflation indicators declined by 12.3 and 14.3 percentage points, respectively, compared to the previous year and stood at 31.7% and 31.1% at the end of 2025.
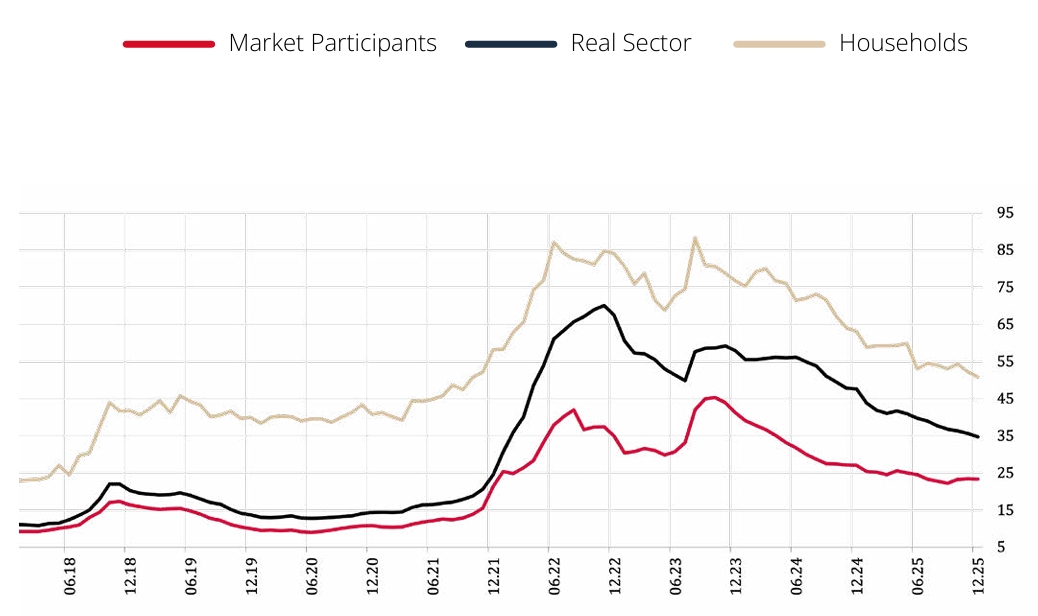
Exhibiting a backward-indexation tendency, rent and education expenses emerged as the groups that had a significant negative impact on headline inflation in 2025. Frost and drought had adverse effects on agricultural production, mainly fruit, putting upward pressure on food prices. On the other hand, having recorded only limited production losses, price increases in vegetables remained below the long-term trend due to temperatures that hovered above seasonal norms in the last quarter of the year, and contributed to the decline in consumer inflation. Aggregate demand conditions remained on a disinflationary track throughout the year. The modest upward trend in the currency basket curbed exchange rate-driven inflationary pressures. In the second half of the year, wage-driven inflationary pressures eased. Commodity prices fluctuated throughout the year amid geopolitical developments and changes in tariffs. As inflation expectations eased, the decline in household and business expectations became evident. However, inflation expectations remained above inflation forecasts and intermediate targets (Chart 2.1.2.4). Following a decline up to May, annual producer price inflation subsequently began to rise. Throughout the year, the impact of cyclical increases in metal prices, combined with the effects of geopolitical tensions and tariff changes, was apparent on producer prices. However, falling transportation costs coupled with the supply chain pressures, which hovered close to their historical averages, contained cost pressures. Accordingly, annual producer price inflation ended 2025 at 27.7%, below the annual CPI inflation rate.
Chart 2.1.2.3: Inflation and Targets (%)
Source: CBRT, TURKSTAT.Last Observation: December 2025
Chart 2.1.2.4: Sectoral Inflation Expectations (12‑month Ahead Annual Inflation Expectations, %)
Source: CBRT.Last Observation: December 2025
Across subgroups, the largest contributor to the decline in annual inflation was the services group, followed by food and core goods. In 2025, other subgroups supported the fall in inflation, albeit at relatively limited rates. In 2025, despite a significant decline, the highest price hike among the main expenditure groups was recorded in the services category, at 44.0%. By the end of the year, among the components of the core group, core goods and services remained approximately 13 percentage points below and above headline inflation, respectively. Annual inflation declined across all subgroups within services, most notably in rents. Nevertheless, rent inflation was high, driven by the backward-indexation tendency and structural factors in the housing sector. In addition, being subject to time dependent price setting and having a strong backward-indexation tendency, inflation in education services also remained high. Inflation in transport services was shaped both by rising fuel prices due to the geopolitical turmoil and the periodic revisions to administered items. However, the loss of momentum in aggregate demand conditions led to a slowdown in price increases in subgroups with demand sensitivity such as restaurants-hotels and recreation and culture items. With a decline throughout the year, services inflation, which declined throughout the year, remained relatively flat at 44 percent in the last quarter.
Prices of core goods rose by 17.7% in 2025, remaining well below headline inflation. Monthly core goods inflation, which remained mild in the first three months of the year, accelerated in the following two months amid developments in financial markets in March. Thus, core goods inflation, which was 19.39% in March on an annual basis, reached 21.09% in June, due mainly to prices of automobiles and electrical and non-electrical appliances. However, these effects did not last, and disinflationary levels of demand conditions mitigated the impact of exchange rate developments on inflation. In the third quarter of the year, annual core goods inflation remained relatively flat at around 20%. In the last two months of 2025, the group’s annual inflation declined again, with monthly increases remaining below those of the previous year.
Although annual inflation in the food and non-alcoholic beverages group rose above headline inflation in August, it receded below headline inflation in the final quarter due to vegetable prices and ended the year at 28.3%. Across subgroups, the main driver of food inflation was processed food prices with a spike of 34.3%. Unprocessed food inflation followed a relatively more favorable course with 21.5%. Three frosts that occurred between February and April 2025 and adverse weather conditions, such as higher-than-average temperatures and lower-than-average rainfall led to a decline in the production of grains, legumes, and nuts, with fruit production in the lead. In addition, the effects of certain agricultural purchase prices and supply-side issues also were other factors shaping food prices. In 2025, the key items in unprocessed food were fruits and nuts, which were affected by frost and drought, as well as red meat products, which were impacted by partial supply-side problems. In the processed food group, bread-cereals, processed meat products as well as cheese and other dairy products stood out.
Annual energy inflation surged by 35.1% in 2025. In the first half of 2025, annual energy inflation remained relatively flat, and settled on an overall downward trend in the third quarter. As price developments in diesel drove the fuel group in November, annual energy inflation rose, but declined following the developments in crude oil prices in December. In 2025, with the transition to the end-source supply tariff, the adjustment to electricity tariffs for residential customers with high consumption had spillovers into electricity prices. In addition to adjustments to administered prices, factors such as municipal water tariffs, increases in lump-sum taxes, and developments in international energy commodity prices shaped energy inflation in 2025.
Supply-Demand Developments, External Balance, and Labor Market
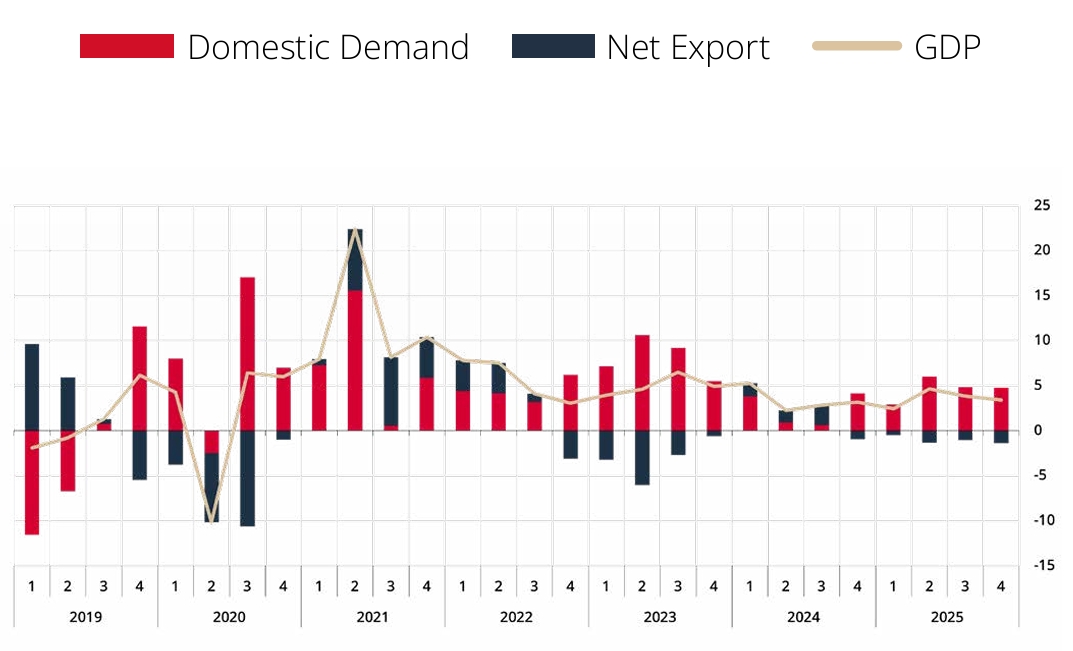
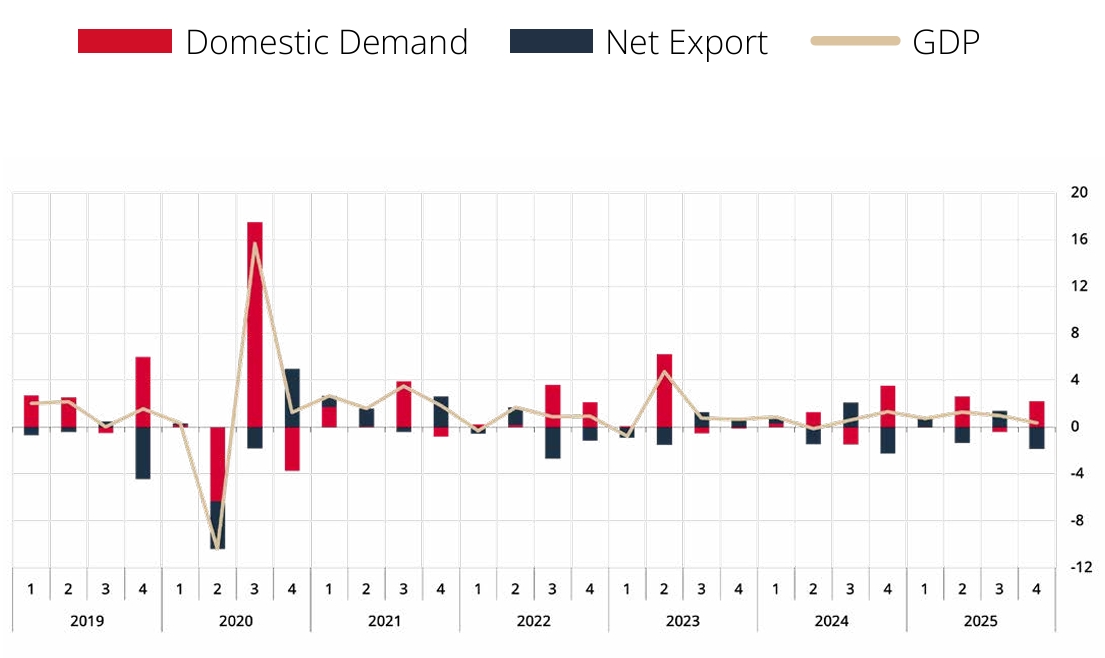
In 2025, economic activity recorded a moderate increase compared to the previous year, with a growth rate of 3.6%. An analysis of developments throughout the year reveals that GDP grew by 2.5% year-on-year and 0.7% quarter-on-quarter in the first quarter of 2025. The main driver of annual growth was the services sector, while the industrial sector curbed growth in the first quarter. During this period, while the annual growth of private consumption slowed, total investments made further positive contributions to annual growth (Chart 2.1.2.5). On a quarterly basis, private consumption and total investment receded. As exports of goods and services increased on a quarterly basis while imports remained flat, net exports made a positive contribution to quarterly growth (Chart 2.1.2.6). Accordingly, in the first quarter of the year, domestic demand weakened as financial conditions remained tight, while the external balance improved. GDP grew by 4.7% year-on-year and 1.3% quarter-on-quarter in the second quarter of 2025, exceeding growth forecasts. On a quarterly basis, the contraction in private consumption seen in the first quarter continued into the second quarter. Meanwhile, total investments increased following the decline in the first quarter, driven by investments in construction and machinery and equipment. In this context, while growth in the second quarter remained above forecasts, final domestic demand was assessed to weak amid a tight monetary policy stance and sustained tight financial conditions. In the third quarter, GDP grew by 3.8% year-on-year and 1.0% quarter-on-quarter. Due to the decline in crop production caused by frost and drought, agricultural value added fell by 12.4% year-on-year in the third quarter, thereby limiting growth. During the same period, private consumption and total investment made positive contributions to annual growth. On a quarterly basis, while private consumption, which had declined in the first two quarters of the year, increased in the third quarter, total investments further supported growth in this period following the second quarter. During this period, imports of goods and services dropped on a quarterly basis, while exports increased. Consequently, net exports made a positive contribution to quarterly growth. Economic activity, which had accelerated in the second quarter, slowed somewhat in the third quarter, posting a growth rate close to its quarterly potential.
GDP grew by 3.4% and 0.4% in annual and quarterly terms respectively in the fourth quarter of the year. During this period, private consumption and investments continued to bolster annual growth. On a quarterly basis, while the positive contribution from private consumption increased compared to the previous quarter, investments made a negative contribution to quarterly growth due to a decline in machinery and equipment investments. In this period, exports of goods and services contracted on a quarterly basis, while imports of goods and services strengthened. Consequently, the contribution of net exports to quarterly growth turned negative. Accordingly, economic activity grew by a modest 3.6% on an annual basis in 2025. From the expenditure side, the contribution of private consumption to annual growth was slightly lower than in the previous year. From the production side, the services sector was the main driver of growth throughout the year, while the industry and construction sectors also contributed to growth. Agricultural value added posted a decline due to the impact of a fall in crop production led by frost and drought.
Chart 2.1.2.5: Gross Domestic Product and Components (Contributions to Annual Growth, % Points)
Source: TURKSTAT.Last Observation: 2025Q4
Chart 2.1.2.6: Gross Domestic Product and Components (Contributions to Quarterly Growth, % Points)
Source: TURKSTAT.Last Observation: 2025Q4
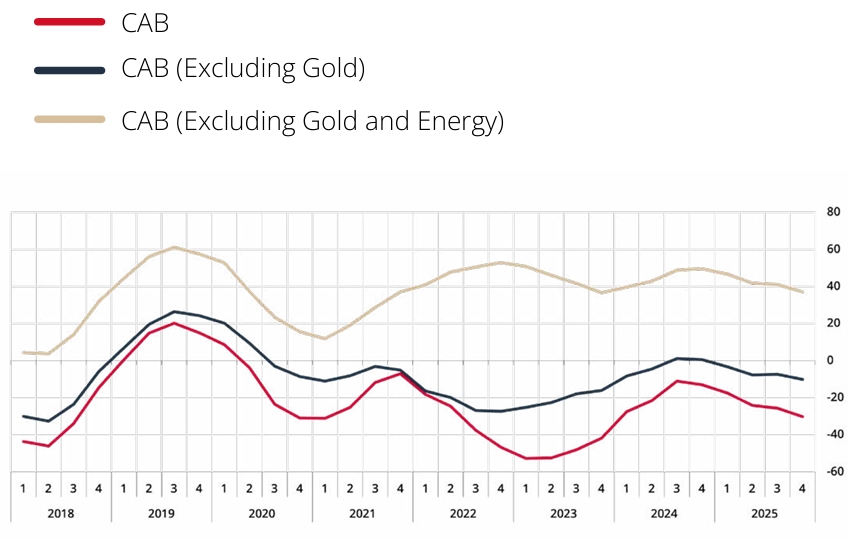
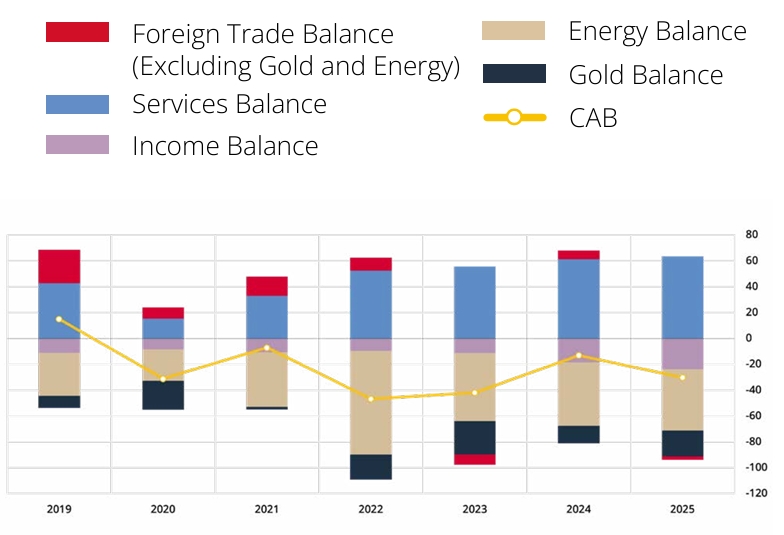
In 2025, the key components of the current account balance revealed that despite the ongoing contribution of the services balance, the current account deficit widened year on year due to the rise in the trade deficit (excluding gold and energy) and the uptick in gold imports (Chart 2.1.2.7). Despite the weak and fragile outlook for economic activity among Türkiye’s main trading partners and uncertainties in global trade throughout the year, exports rose further on an annual basis. This uptick was largely driven by higher export prices. Imports also rose on an annual basis, fueled by both gold and non-gold imports. As a result of rising global gold prices and increased demand for gold, gold imports rose by approximately USD 6 billion compared to the previous year. While imports of investment and consumer goods increased throughout the year, imports of consumer goods followed a more moderate course in the second half of the year. The relatively low trajectory of energy prices continued to improve the energy balance, and the energy trade deficit narrowed on an annual basis. The rise in the number of visitors and travel revenues had further favorable effects on the services balance, and the positive contribution of services to the current account balance grew stronger.
In March 2026, a methodological change will be implemented in the balance of payments data, with a retrospective revision starting from September 2020, in the calculation of interest expenses within the portfolio investments item under the primary income balance. Based on the residency of the security holder, this revision increased the current account deficit by a total of USD 8.9 billion during that period, with USD 4.8 billion of this effect occurring in 2025. The corresponding effect of the revision was seen in the net errors and emissions item in the same amount. Consequently, the overall current account deficit for 2025 rose from USD 25.2 billion to USD 30.1 billion after the revision, while the current account deficit-to-GDP ratio increased from 1.6% to 1.9%.
In 2025, the largest negative contribution to the current account deficit came from the energy balance on an annual basis (Chart 2.1.2.8). On the other hand, this negative contribution decreased to some extent in line with the fall in energy prices compared to 2024. While the services balance had a further positive contribution to the current account balance, deteriorations in the gold balance and the trade balance excluding gold and energy contributed to the increase in the current account deficit. On the financing side, inflows from foreign direct investment by non-residents increased throughout the year. The stock market saw outflows in the first quarter, but inflows occurred in the remainder of the year. The Government Domestic Debt Securities (GDDS) market recorded inflows as of the second half of the year. Accordingly, capital inflows from portfolio investments declined compared to the previous year. Thus, throughout 2025, the share of short-term sources such as portfolio investments in financing decreased, while the share of long-term sources increased. In 2025, the financing of the current account deficit was primarily achieved through long-term credit utilization by the banking sector and the private sector, as well as foreign bond issuances. The banking sector maintained high levels of long-term external debt rollover ratios. The long-term external debt rollover ratio rose to approximately 171% for the banking sector and around 211% for the non-banking private sector.
Chart 2.1.2.7: Current Account Balance (12-Month Cumulative, USD Billion)
Source: CBRT.Last Observation: December 2025
Chart 2.1.2.8: Current Account Balance Composition (USD Billion)
Source: CBRT.Last Observation: December 2025
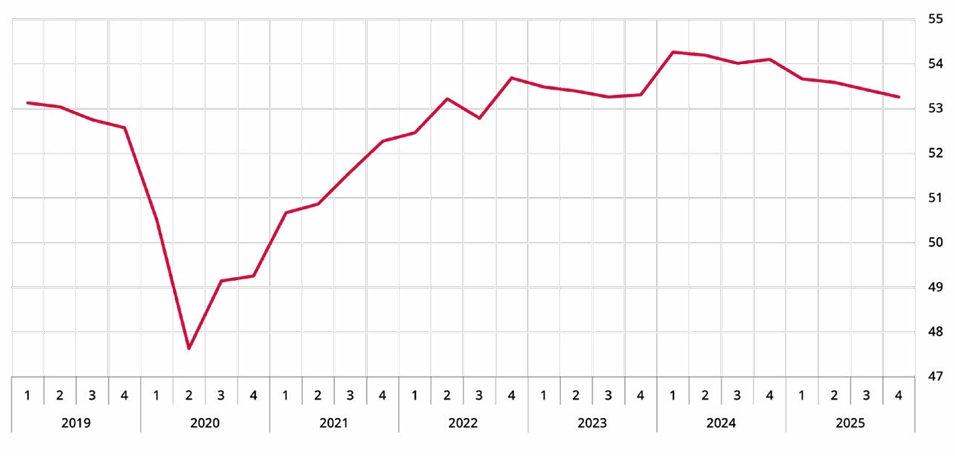
Key labor market indicators suggest that the labor market remained robust in 2025. Total employment remained largely flat throughout the year. The unemployment rate fell by 0.4 percentage points compared to the previous year, dropping to 8.4% (Chart 2.1.2.9). In the first quarter of the year, as employment declined in the agriculture and industry sectors and the labor force participation rate fell, the unemployment rate receded to 8.3% (Chart 2.1.2.10). In the second quarter, while employment in agriculture and industry declined further, employment gains in the services and construction sectors helped limit the overall loss of jobs. During this period, labor force participation remained flat, while the unemployment rate rose. In the third quarter of the year, while employment in the industrial sector continued to fall, total employment increased due to gains in the agriculture, services, and construction sectors. Along with a slight decline in the labor force participation rate, the unemployment rate stood at 8.4% during this period. In the last quarter of 2025, the seasonally adjusted unemployment rate fell by 0.2 percentage points compared to the previous quarter, receding to 8.2%. Meanwhile, the labor force participation rate rose by 0.1 percentage points to 53.5% in the same period. Among complementary labor market indicators, labor underutilization rate rose to 29.7% in 2025. The increase in labor underutilization was mainly driven by growth in the potential labor force, while time-dependent underemployment also increased, and the number of the unemployed decreased.
Chart 2.1.2.9: Unemployment Rate (Seasonally Adjusted, %)
Kaynak: TURKSTAT.Last Observation: December 2025
Chart 2.1.2.10: Labor Force Participation Rate (Seasonally Adjusted, %)
Kaynak: TURKSTAT.Last Observation: December 2025