MENU

Monetary Policy Developments
The CBRT’s policy stance remained tight against the inflation outlook, stabilizing against the FX liquidity and accommodative against financial stability in 2016. In the first quarter of 2016, the slight alleviation of the volatility in global markets accompanied by the active use of policy tools, the tight liquidity policy and prudent macroprudential policy stance reduced the need for a wide interest rate corridor. In the March‑September period of 2016, the decline in inflationist pressures, tightness in financial conditions and the moderate course of global financial markets allowed the CBRT to implement simplification in the interest rate corridor policy. Accordingly, the upper bound of the corridor was lowered by 250 basis points through measured and cautious steps in the March–September period of 2016. Overnight lending rates (upper bound of the corridor) were reduced from 10.75 in March to 8.25 in September. Thus, the corridor width, which was 350 basis points in March, was narrowed down to 100 basis points in September. In this period, the overnight borrowing rate (lower bound of the corridor) and the one-week repo rate were kept unchanged at 7.25 and 7.50 percent, respectively (Graph 4).
Graph 4. CBRT Rates and BIST Interbank O/N Repo Rate
(Percent)
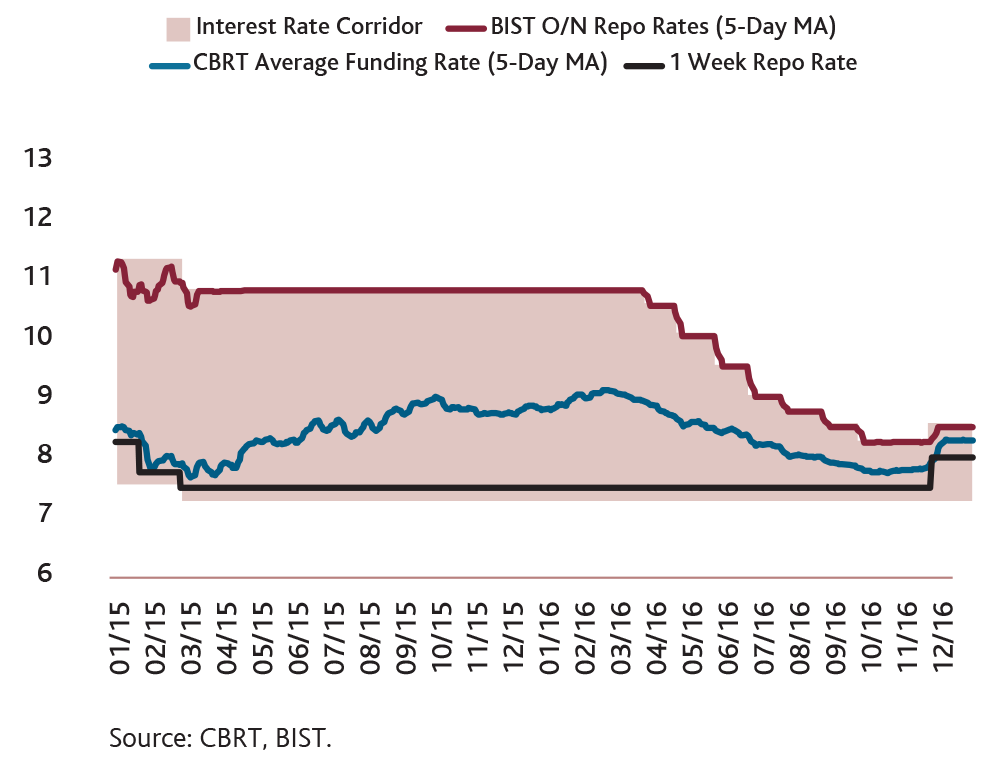
Persisting uncertainties surrounding global economic policies and the upward revision of the US policy-rate expectations caused fluctuations in financial markets and the exchange rate in Turkey as in other emerging economies. To curtail the effects of these developments on inflation expectations and the pricing behavior, the CBRT implemented monetary tightening in November. Accordingly, the one-week repo rate and the CBRT overnight lending rate were raised by 50 and 25 basis points, respectively. Exchange rate movements and soaring oil prices amid the recently increasing global uncertainties pose upside risks to the inflation outlook. On the other hand, aggregate demand developments curtail these effects. For a more reliable evaluation of the net effects of these factors, in consideration of the benefits of the close monitoring of developments, the CBRT did not change the policy rate in December.
In December 2016, one-week repo rate, the CBRT borrowing and lending rates stood at 8, 7.25, and 8.50 percent, respectively.
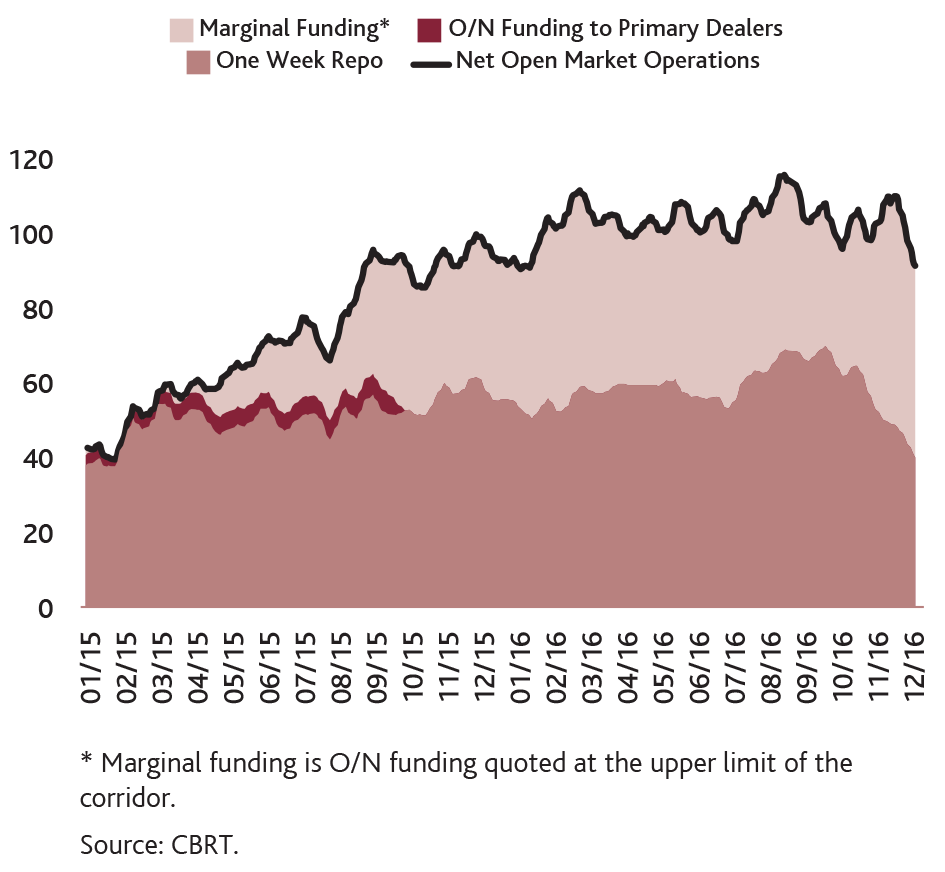
The CBRT funding was mostly made through one-week repo auctions in 2016, and the share of the marginal funding was also kept high. In the last month of the year, both the one-week repo auctions and the marginal funding recorded a decline due to the fall in the system’s funding need (Graph 5).
Graph 5. CBRT Funding
(2-week MA, TL Billion)
The CBRT took various measures regarding the Turkish lira liquidity in 2016. To enhance the foreseeability of the liquidity policy and facilitate more efficiency in banks’ liquidity management, balanced distribution of weekly term funding stock to the days of the week was targeted when determining the daily auction amount of one-week repo funding provided by the quantity auction method starting from 3 June 2016. On 29 June 2016, the CBRT decided to continue conducting the outright purchase auctions until the year-end to support efficient Turkish lira liquidity management. Moreover, the system was provided with liquidity by reducing the Turkish lira reserve requirement ratios by 100 basis points in total for all maturity brackets in August and September. Efforts to simplify conditions for collaterals, which started in 2015, continued in 2016. By the re-arrangement of the rates for excess maintenance and discount of assets accepted as collateral against Turkish lira transactions, the banking sector’s free Government Domestic Debt Securities (GDDS) stock was supported. Regarding the FX collateral deposits, banks’ limits were changed, maturities were diversified, and limits were raised through arrangements put into effect on separate days.
The CBRT adopted a series of liquidity measures to contain spillovers from the mid-July turbulence into financial markets and to enable the smooth functioning of markets. Accordingly, Turkish lira deposit transactions were allowed to provide unlimited liquidity and the commission for the intraday liquidity facility was lowered to zero. Additionally, to inject Turkish lira liquidity, banks were allowed to place limitless FX deposits as collateral. The flexibility of collateral management offered to banks through this facility bolstered banks’ liquidity management programs and contributed to the decline in off-balance sheet FX positions. Moreover, the composition of the set of securities pledged as collateral against the CBRT’s Turkish lira liquidity facilities was also changed. As the need for the limitless collateral FX deposit facility abated in time due to the liquidity measures in place, the CBRT reinstated the use of upper limits on collateral FX deposits as of 11 November 2016.
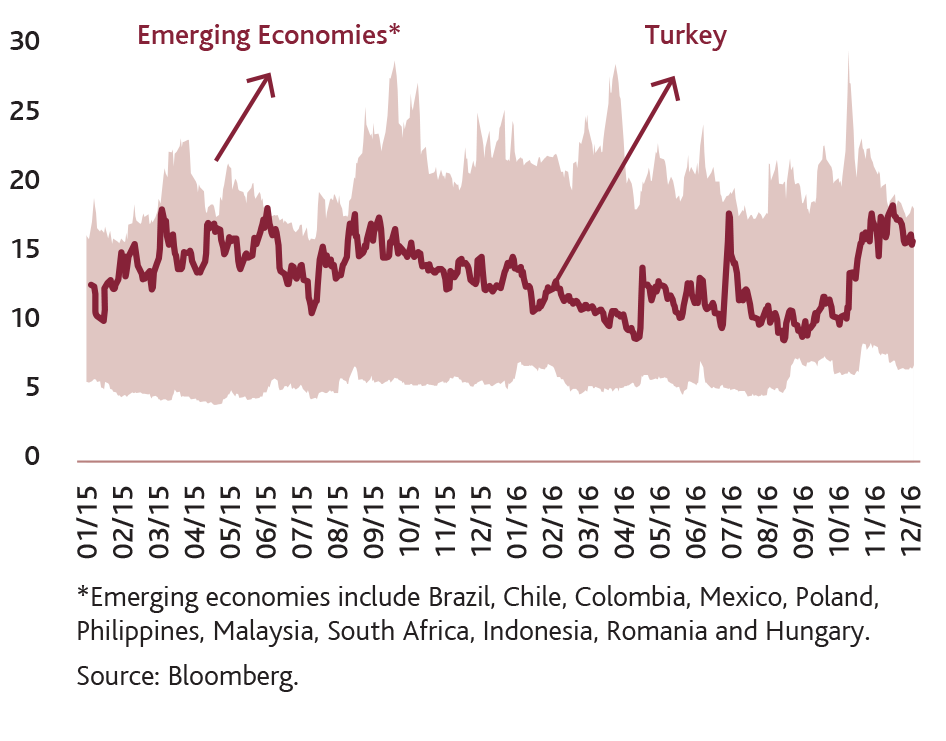
In addition to the Turkish lira liquidity management, the CBRT also took steps towards boosting the FX market liquidity in 2016 to counteract the exchange rate fluctuations of the second half (Graph 6). Foreign currency required reserve ratios and reserve option coefficients were cut gradually through the year, providing additional FX liquidity for the financial system. Additionally, measures such as the facility to allow extended maturities or Turkish lira payments for remunerations on export rediscount credits until the end of the year, restoring the limits on collateral FX deposits and the decision to have part of the demand from energy-importing public institutions met by the CBRT and the Treasury at market conditions all helped boost the FX liquidity in the market.
Graph 6. Implied FX Volatility
(1-month-ahead, Percent)
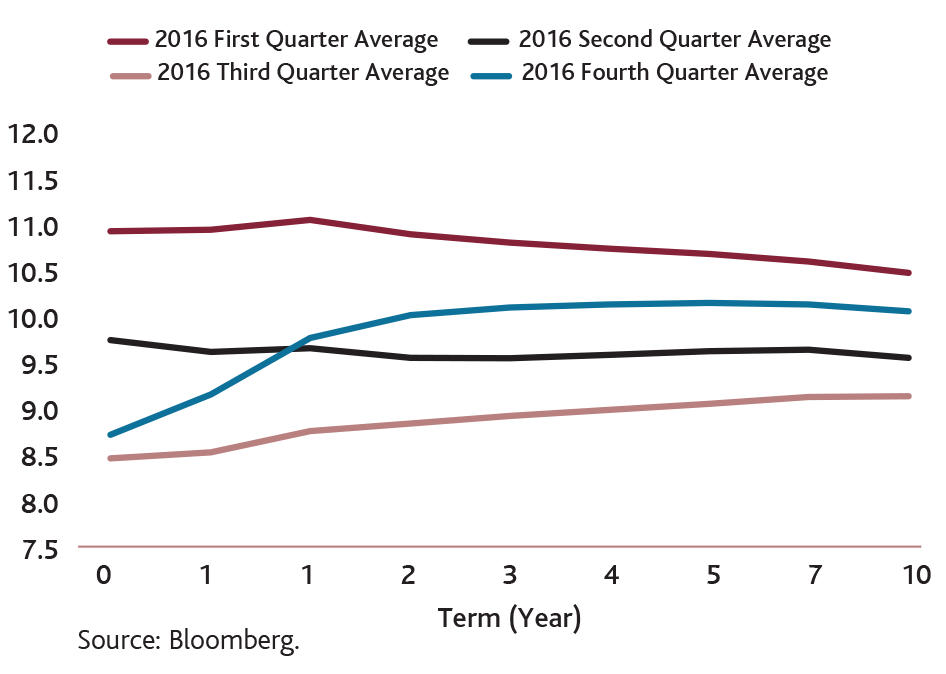
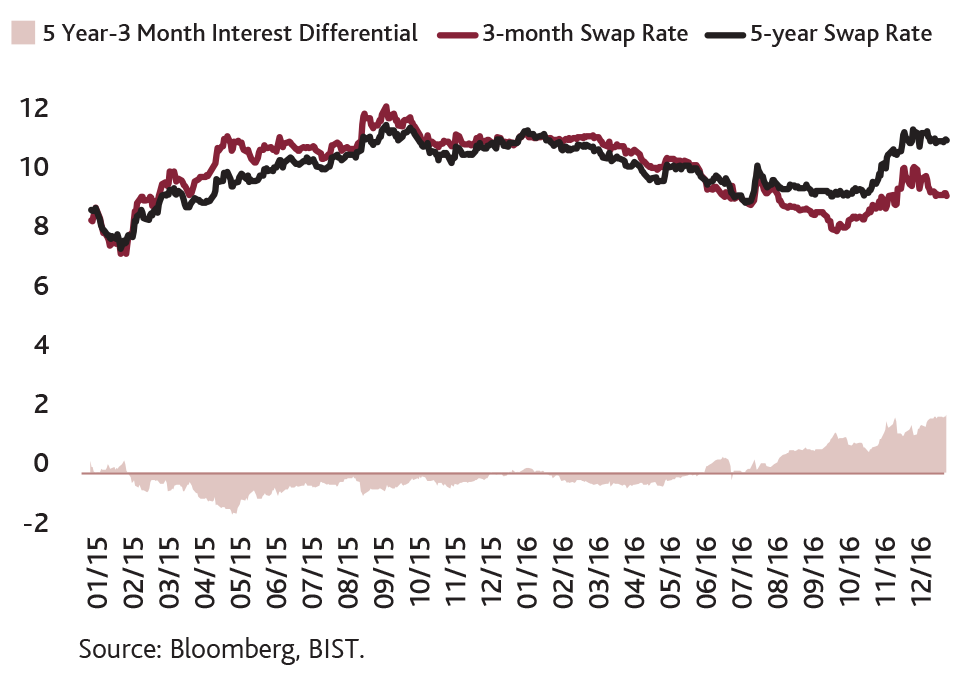
The yield curve remained almost horizontal through the year. Low interest rates across advanced economies and reduced CBRT funding rates caused the yield curve to shift down for all maturities in the first three quarters. However, amid mounting global uncertainty in November and December, the fourth-quarter average of the yield curve sloped upward (Graph 7). The spread between 5-year and 3-month currency swap rates turned positive by mid-2016, but increased in the fourth quarter due to higher 5-year interest rates (Graph 8).
Graph 7. Yield Curve on Cross Currency Swaps
(Percent)
Graph 8. Cross Currency Swap Rates
(Percent, 5-day MA)
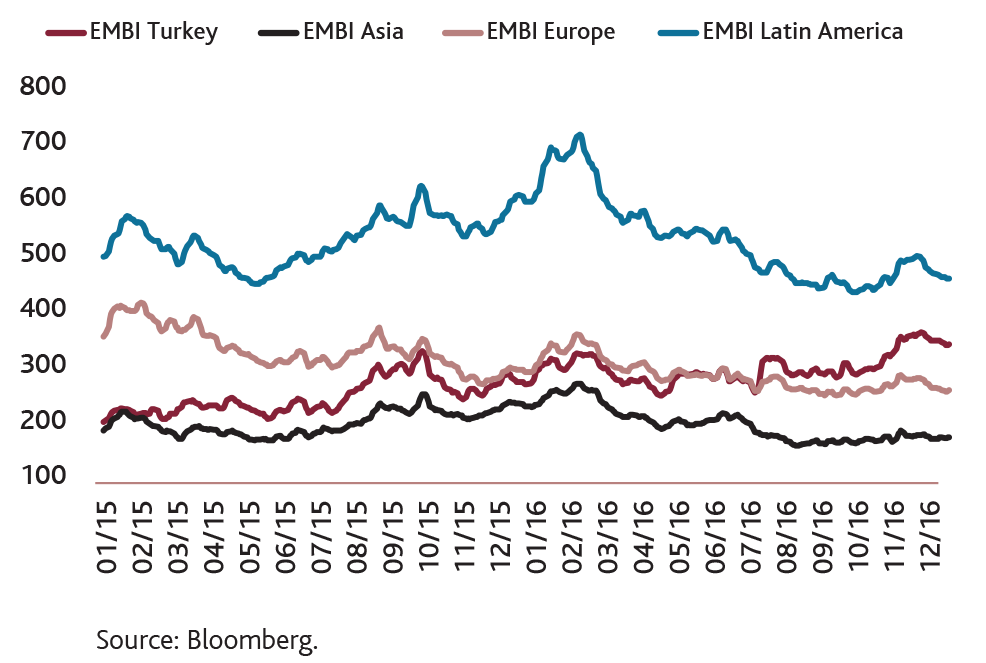
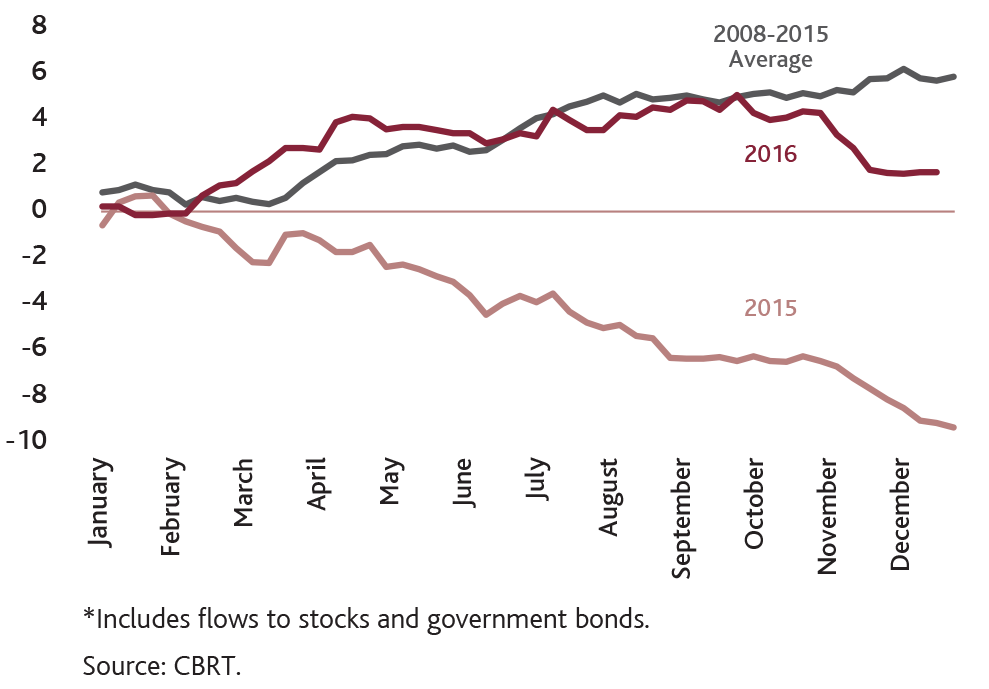
The heightened global uncertainty and growing risk aversion following the US presidential election in November 2016 sent emerging market risk premiums soaring. Likewise, Turkey’s sovereign risk premium was markedly higher in 2016 (Graph 9). As a result, emerging economies witnessed portfolio outflows while portfolio flows destined for Turkey were below the average of past years (Graph 10).
Graph 9. Regional Risk Premiums
(5-day MA, Basis points)
Graph 10. Portfolio Flows to Turkey
(USD Billion)
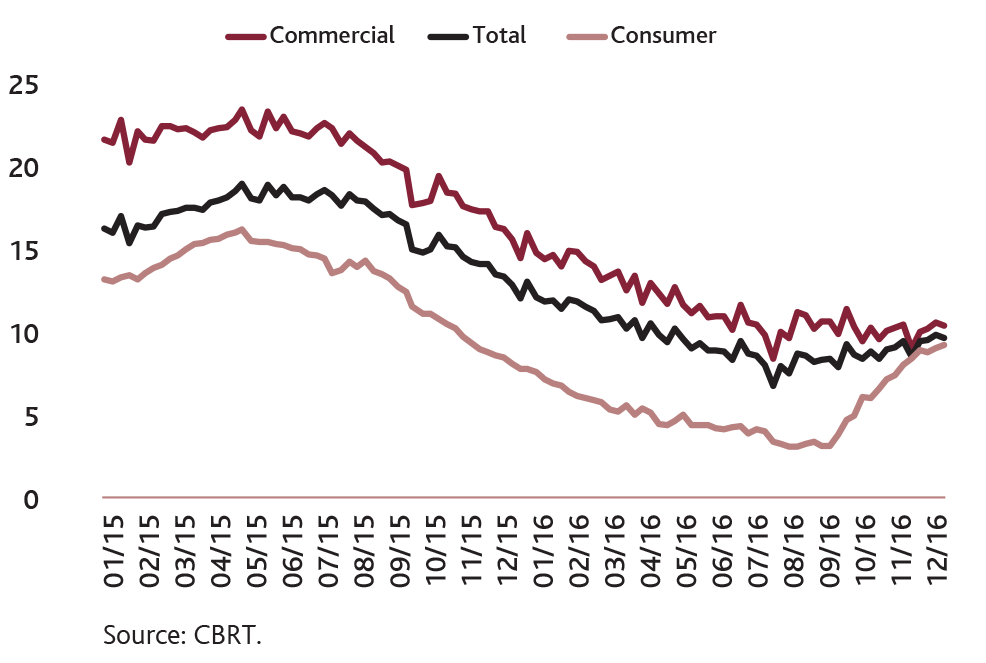
The annual growth rate of loans to nonfinancial enterprises stopped declining in the third quarter of 2016. Measures taken by the Banking Regulation and Supervision Agency (BRSA) in previous years and the weak consumer confidence helped consumer loans grow moderately, but thanks to more accommodative monetary conditions in recent months and macroprudential measures intended to boost consumer loans, consumer loan growth accelerated (Graph 11).
Graph 11. Annual Loan Growth Rates
(Adjusted for Exchange Rate, Annual Percentage Change)
Inflation Developments
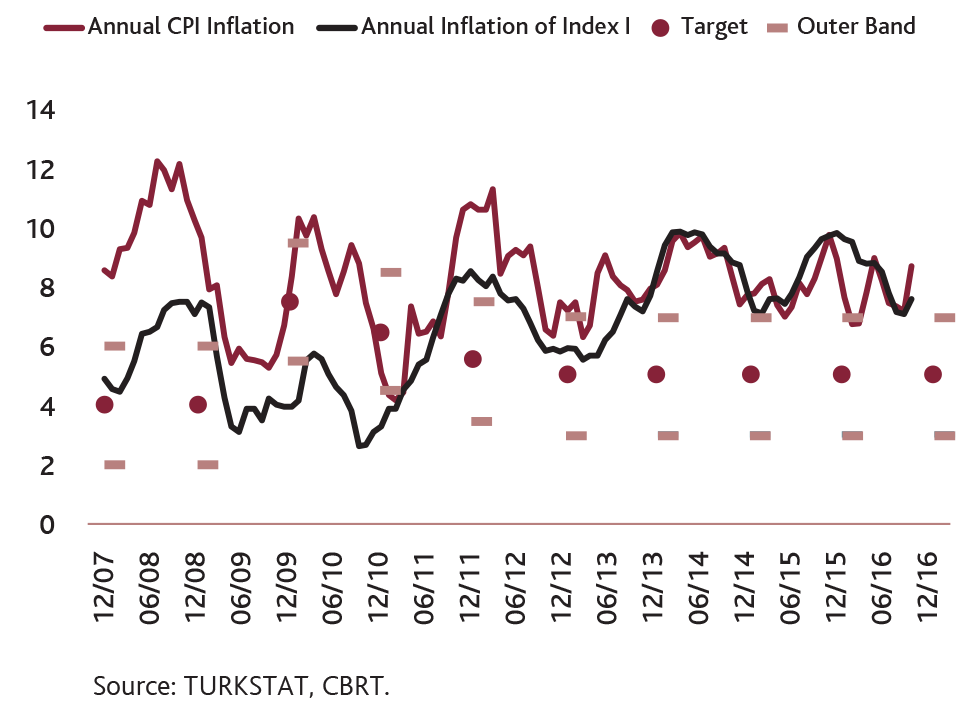
Inflation ended 2016 at 8.53 percent, down 0.28 points from a year earlier (Graph 12). The breach of the uncertainty band around the inflation target was due largely to the TL depreciation as well as to the minimum wage adjustment and tax adjustments (for tobacco, fuel, automobiles, etc.). In 2016, import prices, particularly oil prices, provided less support for inflation than in 2015. Annual energy inflation soared remarkably in the fourth quarter amid climbing exchange rates and oil prices and readjusted fuel taxes. Real unit wages made an increased contribution to inflation compared to 2015, the pass-through effects of which were more evident in labor-intensive sectors particularly services. After January’s tobacco tax hikes caused tobacco prices to surge, tobacco companies announced new, non-tax-driven, price increases in July. The second special consumption tax (SCT) adjustment on alcohol and tobacco in December 2016 and companies raising prices at a higher rate than implied by the lump-sum SCT added another drag on consumer inflation. Moreover, the underlying trend of core goods inflation strengthened in the final quarter amid the Turkish lira depreciation.
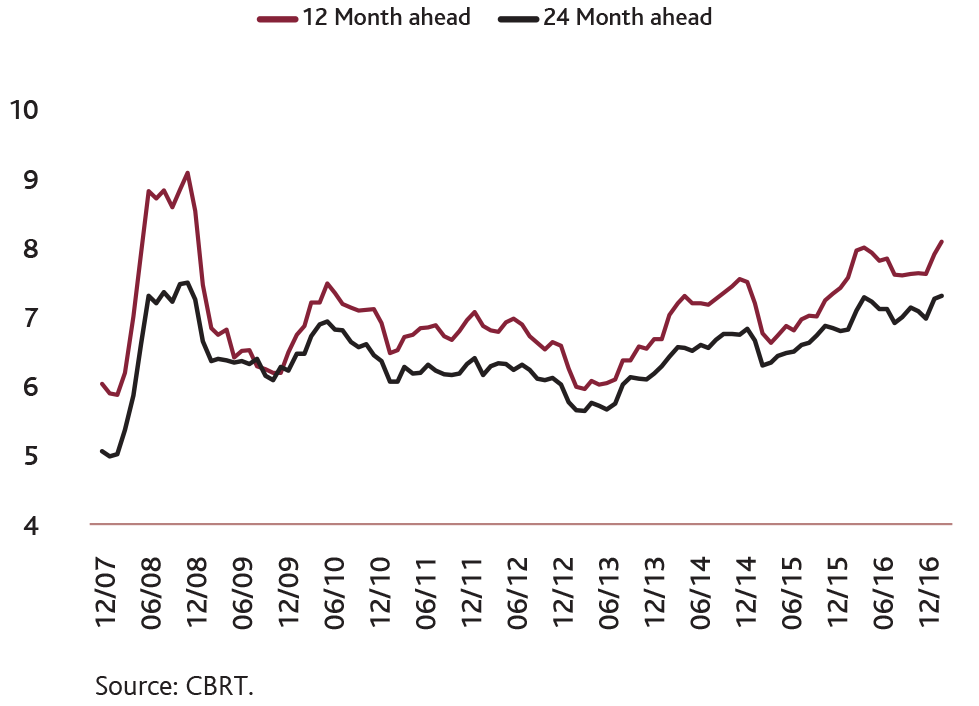
On the other hand, weaker domestic demand and food prices that were up only slightly in 2016 compared to previous years due to the tourism slump putting a lid on inflation. Thanks to the benign consumer inflation outlook since February, medium-term inflation expectations continued to improve until June before remaining flat in the third quarter. However, the massive Turkish lira depreciation and the climbing inflation caused expectations to deteriorate in November and December (Graph 13).
Graph 12. Inflation and Targets
(Percent)
Graph 13. Inflation Expectations
(Percent)
GDP Developments, Rebalancing and Labor Market
According to TURKSTAT’s GDP data with base year 2009, the growth rate was up from 5.2 percent in 2014 to 6.1 percent in 2015. For base year 1998, GDP growth was 3.0 and 4.0 percent in 2014 and 2015, respectively, which is much lower than the newer GDP series. Yet, in both series, the growth rate accelerated from 2014 to 2015. This GDP growth in 2015 was mostly driven by the upsurge in private consumption demand. An array of negative shocks led to a marked slowdown in the economy through 2016.
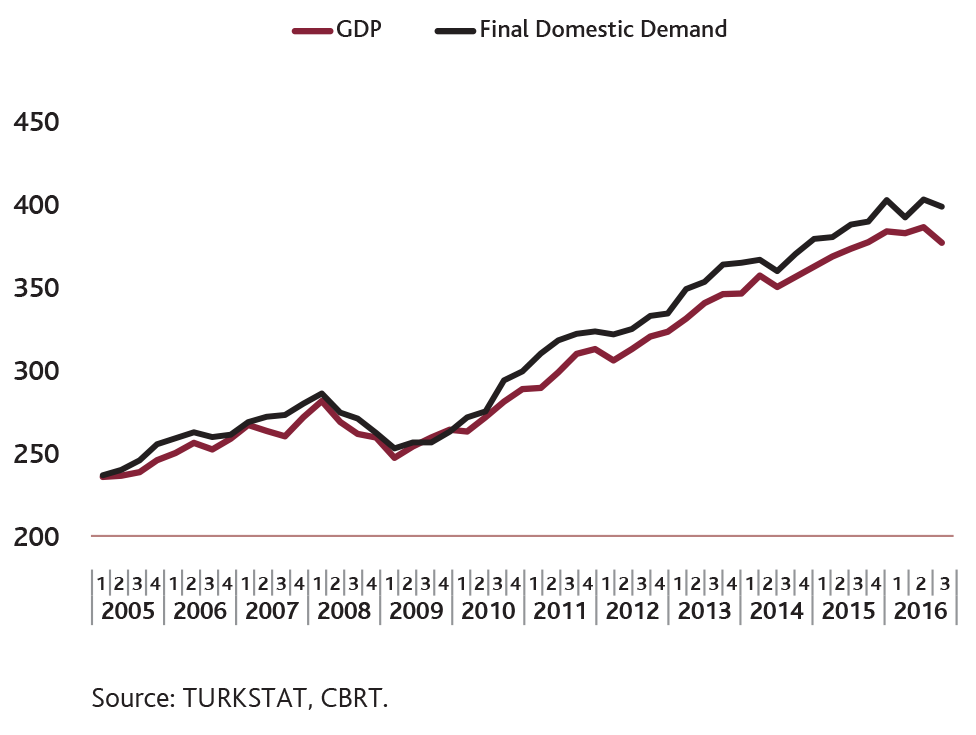
Geopolitical tensions as well as increased terrorist attacks and rocky relations with Russia dampened tourism and exports of goods. In addition, after the failed coup attempt in July, consumer and investor confidence weakened while the economic slowdown intensified (Graph 14). In the last quarter of the year, financial markets also grew more volatile due to the mounting uncertainty regarding advanced economies. Although the economy displayed a fast rebound on the back of the support from public expenditures as well as measures taken in the last quarter, the growth rate remained weak across 2016 compared to past years.
Graph 14. Gross Domestic Product and Final Domestic Demand
(Seasonally Adjusted, Real, TL Billion)
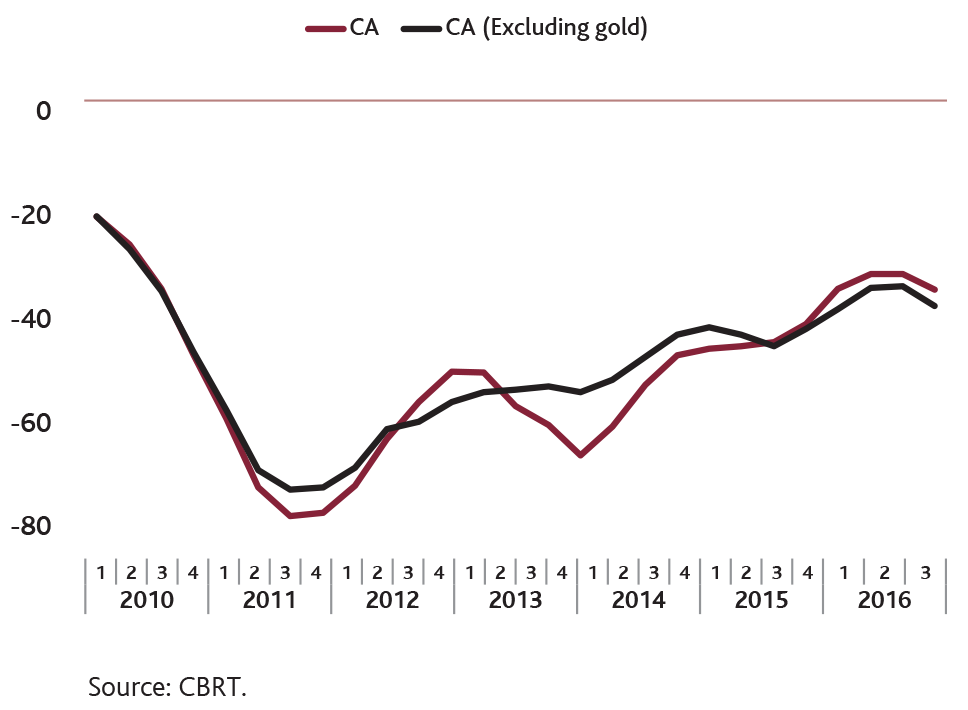
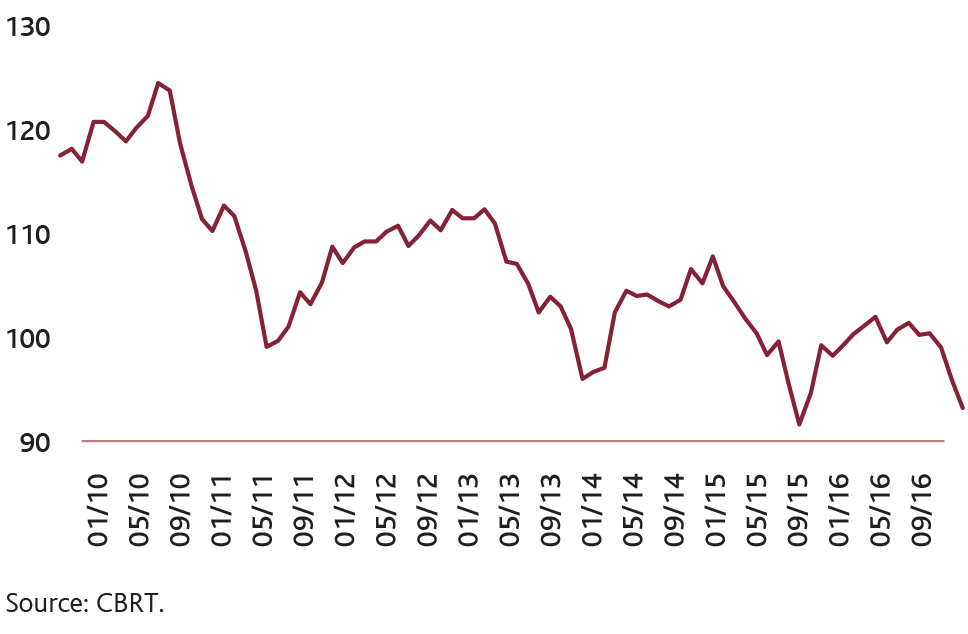
The recovery process in the current account balance that started in 2014 continued until the third quarter of 2016. Despite the ongoing contribution from the fall in energy prices to the recovery in the current account balance, adverse geopolitical developments curtailed export growth and dampened tourism revenues, which resulted in a deceleration of this recovery in the second quarter (Graph 15). However, owing to the sustained mild demand conditions in the European Union (EU) countries coupled with domestic demand conditions, imports remained weak, which restricted the deterioration in the current account balance. In this period, favorable developments in the terms of trade and the mild course of consumer loans proved to be prominent supportive factors. On the other hand, the real exchange rate, which started to appreciate in the third quarter of 2015 from historically low levels, depreciated as of the second half of 2016 due to the rise in the nominal exchange rates (Graph 16). A co-evaluation of the appreciation trend in the first half and the depreciation trend in the second half of the year suggests an average depreciation of the real exchange rate by 0.2 percent on an annual basis across 2016, staying close to the levels in 2015.
Graph 15. Current Account Balance
(12 Month Cumulative, USD Billion)
Graph 16. Real Effective Exchange Rate Index
(Consumer Price Index Based, 2003=100)
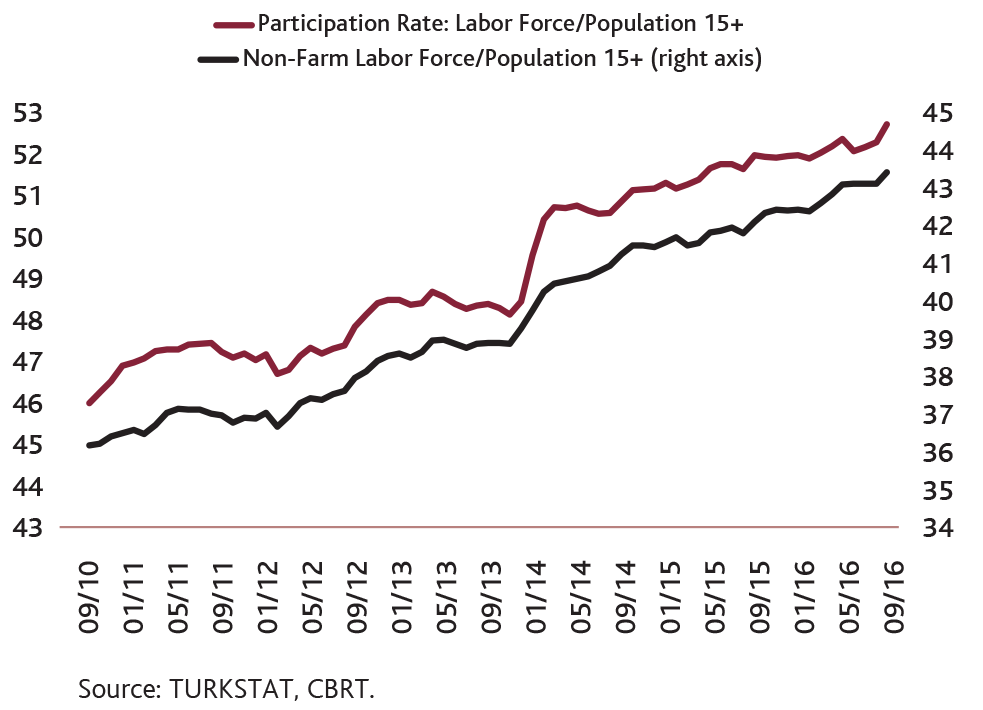
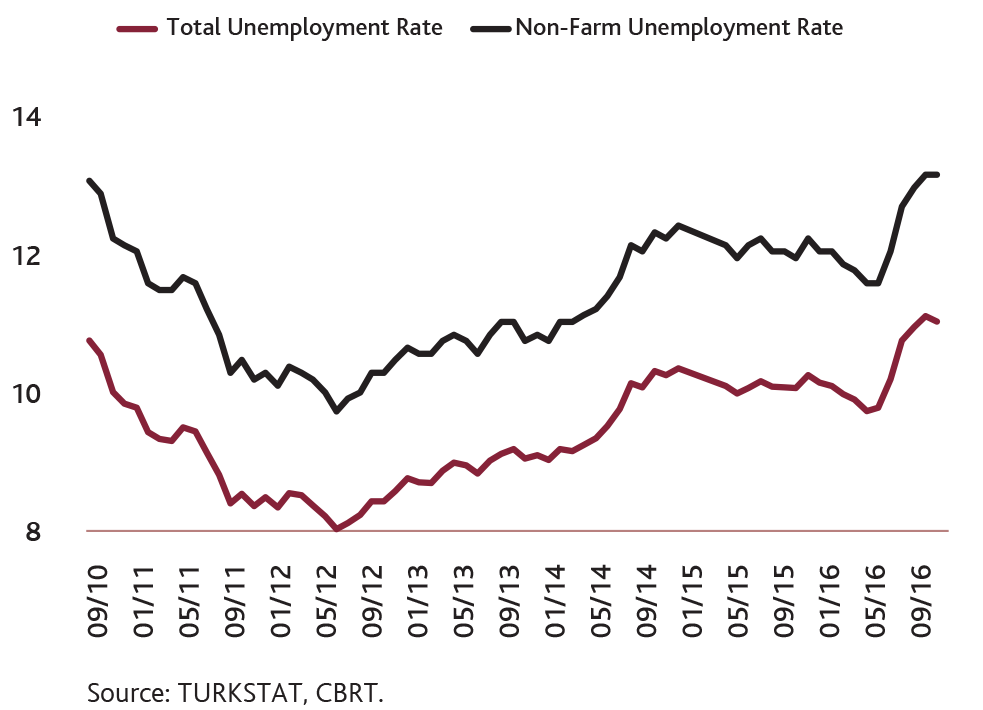
In the first four months of 2016, total and non-farm unemployment rates posted a year-on-year decline, yet recorded a notable increase in the May-September period amid the slowdown in economic activity (Graph 17). The rise in the unemployment rate is attributed to the deceleration in the employment trend accompanied by the rise in the labor force (Graph 18). In the first nine months of the year, non-farm employment growth remained limited compared to the same period of the previous year. The main drivers of non-farm employment growth proved to be services and construction sectors in this period, while the industrial sector employment exhibited a weak outlook.
Graph 17. Unemployment Rates
(Percent, Seasonally Adjusted)
Graph 18. Ratio of Labor Force to 15+ Population
(Percent, Seasonally Adjusted)